
1. Civilization and energy
2. Energy and power
3. Hydrocarbons
4. Cutting emissions
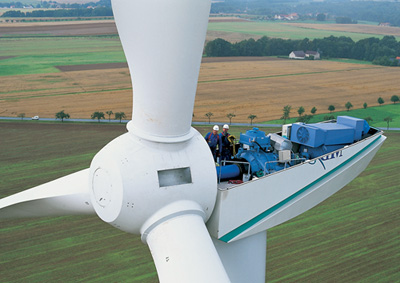
5. Renewable energy
6. Nuclear power
7. New energy
8. Sources
Hydrocarbons (fossil fuels) have an energy density far higher than traditional, renewable energy sources, and their large-scale use has resulted in the total energy consumption of human societies rising to unprecedented levels. Vaclav Smil writes:
Traditional societies drew their food, feed, heat, and mechanical power from sources that were almost immediate transformations of solar radiation (flowing water and wind) or that harnessed it in the form of biomass and metabolic conversions that took just a few months (crops harvested for food and fuel), a few years (draft animals, human muscles, shrubs, young trees), or a few decades (mature trees) to grow before becoming usable. In contrast, fossil fuels were formed through slow but profound changes of accumulated biomass under pressure; except for young peat, they range in age from 106 to 108 [1 to 100 million] years. (2010a, 710-11)
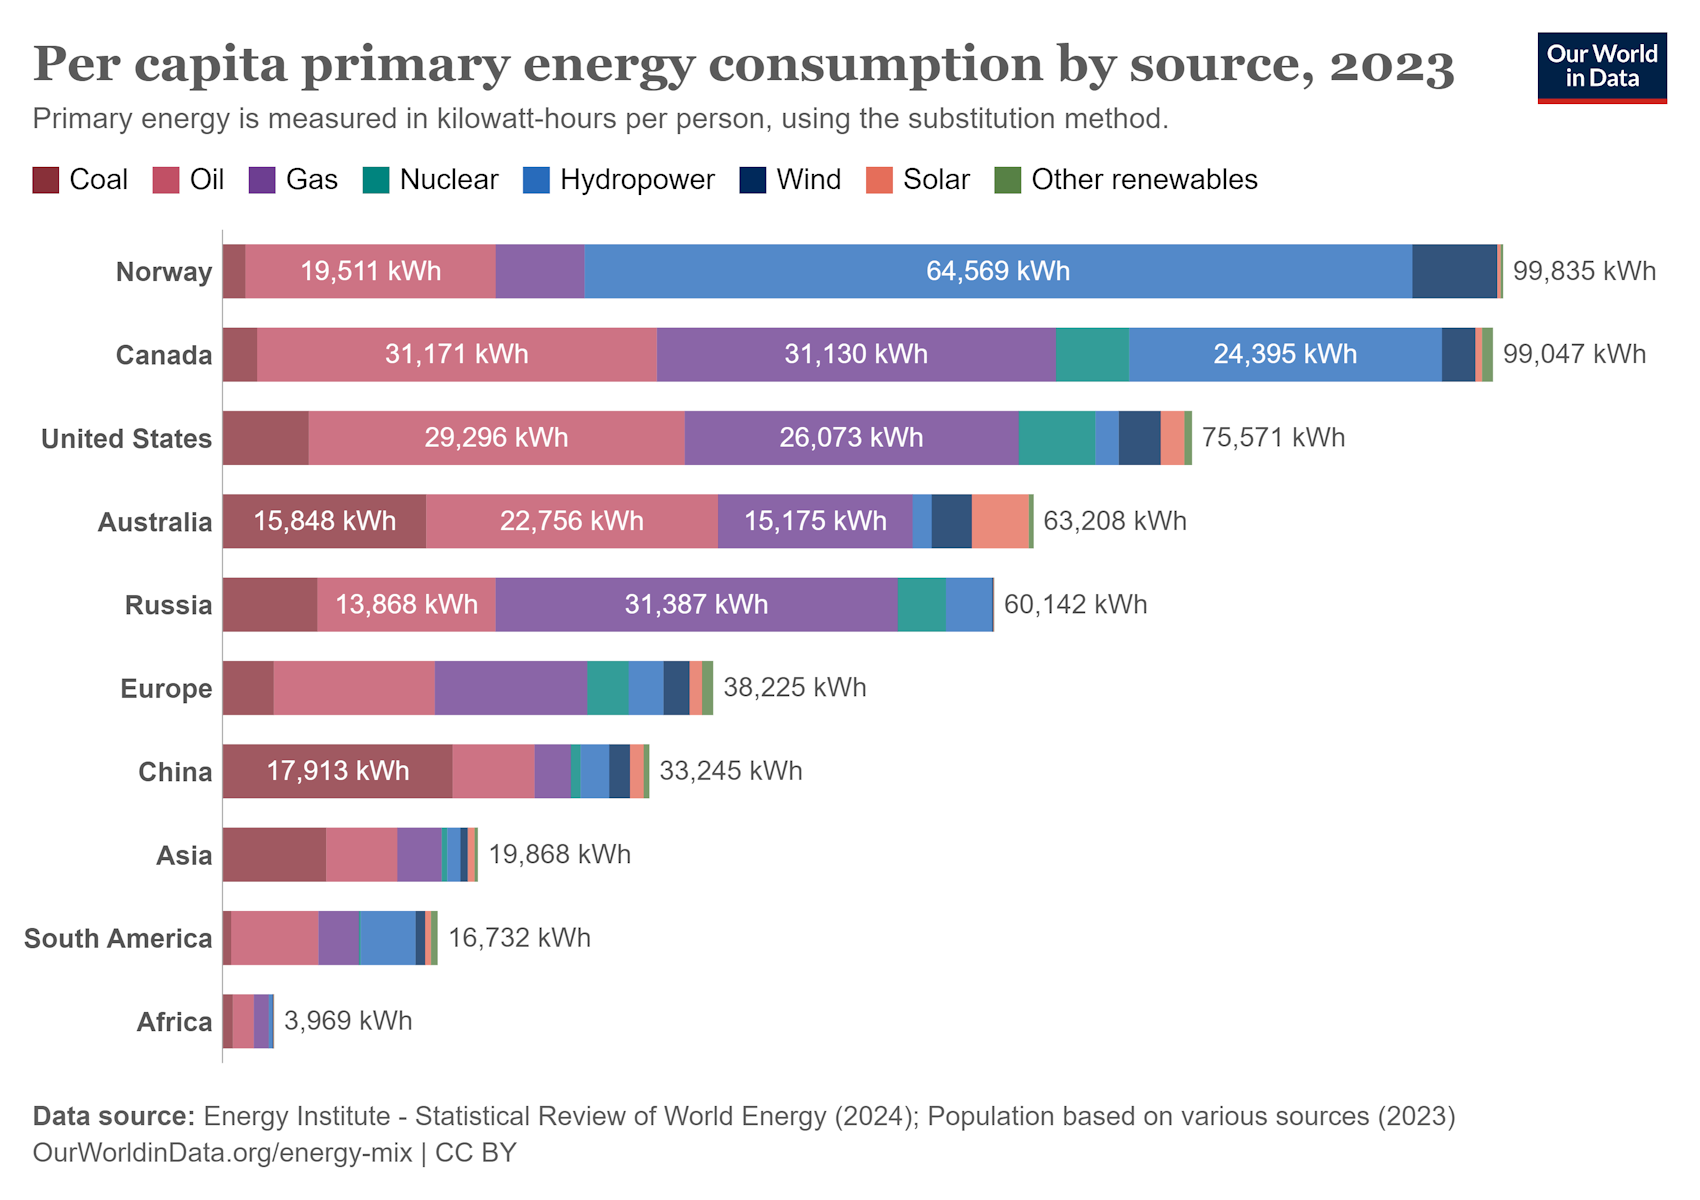
Pre-agricultural societies consumed around 10 billion joules (gigajoules, GJ) of energy per capita per year, roughly divided between food and vegetation for open fires. By the late 19th century the figure had risen to about 100 GJ per capita in industrial England, nearly all of it coming from coal. A century later, the major economies of Europe, as well as Japan, averaged around 170 GJ per capita, with coal, oil and natural gas all contributing a significant share. In 2023 the average annual energy consumption stood at 270 GJ per capita in the United States, 216 GJ in Russia, 138 GJ in Europe, 120 GJ in China, 72 GJ in Asia, 60 GJ in South America, and 14 GJ in Africa.
1 GJ = 278 kilowatt-hours (kWh). (ourworldindata)
The G7 countries (United States, Canada, United Kingdom, France, Germany, Italy, Japan) account for just under 10% of the global population, but were responsible for 44% of global primary energy consumption in 2000 and 26% in 2023. Russia and China account for 19% of the global population, and were responsible for 17% of global primary energy consumption in 2000 and 33% in 2023 (ourworldindata).
High levels of affluence and consumerism do not automatically mean higher levels of individual happiness and satisfaction with life. Smil (2010a) says that pushing beyond 110 GJ per capita has not brought many fundamental quality-of-life gains, while pushing beyond 200 GJ per capita has largely been counterproductive. He writes: ‘the US falls behind Europe and Japan in a number of important quality-of-life indicators, including much higher rates of obesity and homicide, relatively even higher rates of incarceration, lower levels of scientific literacy and numeracy, and less leisure time.’ Wealthy societies waste a lot of energy on short-lived disposable junk and dubious pleasures and thrills promoted by mindless advertising.
There is no possibility of an energy consumption of over 150 GJ per capita, currently enjoyed by one-sixth of humanity, being extended to the rest of the world during the next few generations. There are voices in the privileged West that oppose any significant industrial development in the poorer nations on the grounds that it would be unsustainable and critically damage the environment. Those who preach that message should perhaps set a good example by switching off all their electrical appliances and gadgetry and withdrawing entirely from our modern technological society.
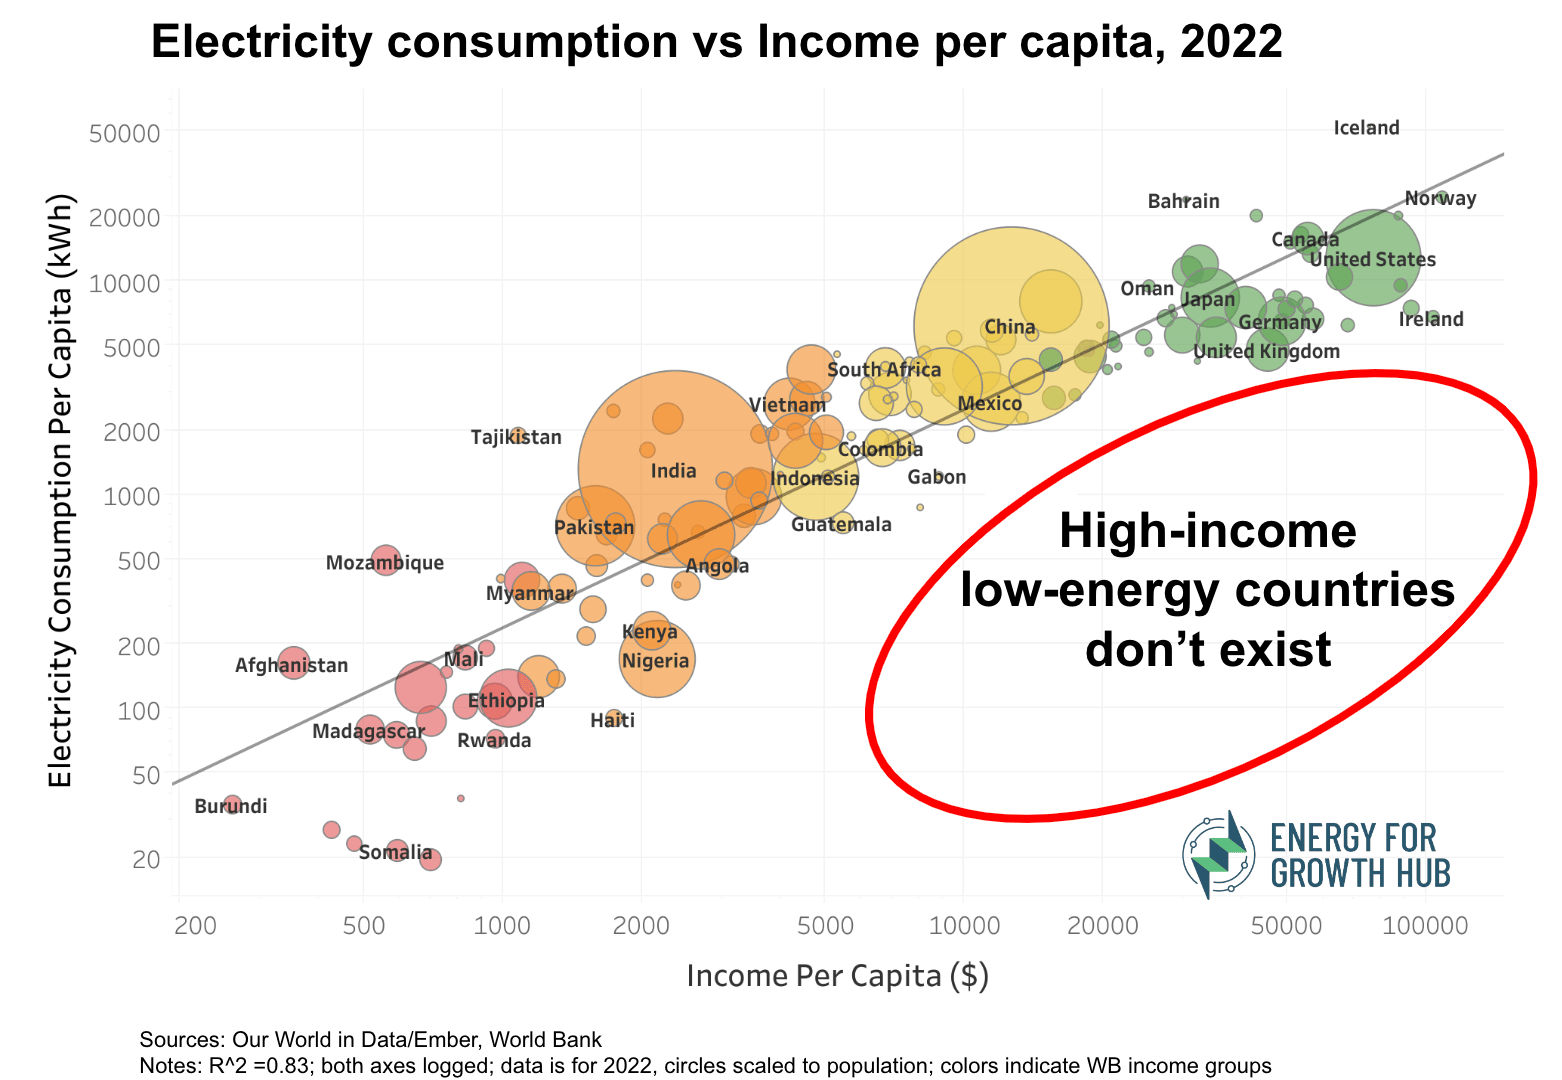
(energyforgrowth; interactive version)
There are enormous inequalities in wealth distribution and energy consumption not only between different countries but also within them. In 2024 3.6 billion people were living in poverty (<$6.85/day), and 700 million people were living in extreme poverty (<$2.15/day) (worldbank).
In sub-Saharan Africa the infant mortality rate can be as high as 117 deaths per 1000 live births (ourworldindata). Infant mortality rates of less than 30 typically correspond to per capita energy use of at least 30-40 GJ per year. Infant mortality rates of less than 20 are found only in countries consuming at least 60 GJ per capita, and rates of less than 10 are found only in countries using more than about 110 GJ. Female life expectancy of over 70 years typically corresponds to per capita energy use of at least 45-50 GJ per year, while a female life expectancy of over 75 requires about 60 GJ, and of over 80 about 110 GJ (Smil, 2008a, 346).
Energy poverty means insufficient access to affordable, reliable and safe energy services to support economic and human development. Around 750 million people still lack access to electricity, and 2.1 billion rely on traditional biomass – such as wood, crop residues and dung – for cooking and heating. Household air pollution, caused mainly by the use of biomass in inefficient stoves, causes 3.2 million premature deaths per year (iea; who). Greater access to liquid and gaseous fuels and electricity would reduce poverty and improve human health. Even doubling the poor world’s average per capita energy consumption to about 40 GJ per year would be sufficient to guarantee a decent standard of living and quality of life.
In the United States one in three households today experiences energy poverty. In the United Kingdom 21.5% of households experience fuel poverty. In the European Union between 8% and 16% of the population is facing energy poverty, depending on the criteria used. In Greece and Bulgaria, nearly 30% of the population is energy poor, while in western and northern EU countries, the figure drops below 5%.
Basics
A force changes an object’s state of rest or motion. Force = mass x acceleration. A force of 1 newton imparts an acceleration of 1 m/s2 to a mass of 1 kg. 1 N = 1 kg m/s2
Energy is the ability to do work. Energy = force x distance. 1 joule is the energy expended (or work done) in applying a force of one newton through a distance of one metre. 1 J = 1 N m
Power is the rate of using energy (or doing work). Power = energy / time. A power of 1 watt is equal to an energy flow of 1 joule per second. 1 W = 1 J/s
The amount of energy generated or consumed is measured in joules; power is the rate at which energy is generated or consumed and is measured in watts. There are however many other units of energy and power. For instance, 1 horsepower equals 746 watts. Energy consumption is often expressed in kilowatt-hours (kWh; 1 kW = 1000 W). For instance, using a computer and LCD monitor with a total power rating of 110 W for one hour consumes 0.11 kWh of electricity. In 2023 the total energy consumption of an average European was 105 kWh per day, while the average American consumed about 207 kWh per day (ourworldindata).
Two important measures for comparing different sources of energy are energy density and power density. Energy density refers to the amount of energy contained in a given unit volume, area or mass. Power density often refers to the amount of power that can be generated per unit land or water area.
The energy density of wood is, at best, 17 million joules (megajoules) per kilogram (MJ/kg), for good-quality bituminous coal it is 22-25 MJ/kg, and for refined oil products it is around 42 MJ/kg. That is why coal is preferred over wood, and oil over coal. Vaclav Smil (2010b) writes:
the more concentrated sources of energy give you many great advantages in terms of their extraction, portability, transportation and storage costs, and conversion options. If you want to pack the minimum volume of food for a mountain hike you take a granola bar (17 J/g) not carrots (1.7 J/g). And if you want to fly across the Atlantic you will not power gas turbines with hydrogen: the gas has a gravimetric density greater than any other fuel (143 MJ/kg) but its volumetric density is a mere 0.01 MJ/L [megajoules per litre] while that of jet fuel (kerosene) is 33 MJ/L, 3,300 times higher.
Energy exists in different forms, such as chemical, thermal (heat), nuclear, electrical, mechanical, and radiant (electromagnetic radiation). Any conversion of one form of energy into another involves some loss of energy, and the efficiency is therefore always less than 100%. Over time, technological advances have made higher efficiencies possible.
Traditional hearths and fireplaces had efficiencies below 5%. Wood stoves were usually less than 20% efficient. Coal stoves doubled that rate, and fuel-oil furnaces brought it to nearly 50%. Efficiencies of natural-gas furnaces were initially below 60%, but by the 1990s there was a large selection of furnaces rated at about 95%. (Smil, 2010a)

Thomas Edison’s Jumbo dynamo (inventionandtech). Edison opened Pearl Street Station – the first central power plant in the United States – in Manhattan, New York, in 1882. His generators converted less than 2.5% of the heat energy in coal into electricity. Some modern coal-fired power plants can convert nearly half of the coal’s heat energy into electric power, and the electricity produced is 105 times cheaper than that produced by Edison (Bryce, 2008, 54, 68).
An examination of the power density (expressed as energy flux per unit of horizontal surface) of different energy sources starkly reveals the limitations of renewable energy sources compared with hydrocarbons. The estimated values for each source can vary by an order of magnitude or more depending on the precise details and conditions of the facilities in question, and what is included in the calculation, but the general message is clear.
| Power source | Power density (W/m2) |
Nuclear
|
up to 4000 (Smil, 2010b, 2008a) |

Median power densities (W/m2). (Saunders, 2020)
In other words, renewable energy facilities would have to be spread over areas ten to ten thousand times larger than today’s hydrocarbon energy facilities to produce the same amount of power. Although this is not an impossible feat, it poses many regulatory, technical, logistical and environmental challenges, and it would take many decades to put such a system in place – even if there were no local opposition. For as Robert Bryce (2008, 92) says:
Energy sources with high power densities have the least deleterious effect on open space. They allow us to enjoy mountains, plains, and deserts without having views obstructed or disturbed by spinning wind turbines, sprawling solar arrays, towering transmission lines, or miles of monocultured crops. ... Energy projects with small footprints are not only green, they reduce the potential for NIMBY [not-in-my-backyard] objections.
Photosynthesis is the process whereby plants, algae and certain species of bacteria convert carbon dioxide (from the atmosphere) and water, with the help of sunlight, into sugars (carbohydrates) and oxygen (released as ‘waste’). The photosynthetic conversion of solar radiation into stored biomass energy has a very low efficiency – just 2% for the most efficient plants in Europe (MacKay, 2009, 43). Although biomass itself has a low energy density, hydrocarbons such as coal, oil and natural gas are highly concentrated stores of photosynthetic energy.
Due to the enormous amount of geologic energy invested in their formation, fossil fuel deposits are an extraordinarily concentrated source of high-quality energy, commonly extracted with power densities of 102 or 103 W/m2 of coal or hydrocarbon fields. This means that very small land areas are needed to supply enormous energy flows. In contrast, biomass energy production has densities well below 1 W/m2 ... (Cleveland, 2011)
According to the prevailing biogenic theory, hydrocarbons are formed from the fossilized remains of dead plants and animals by exposure to heat and pressure in the earth’s crust over millions of years. Hydrocarbons are considered nonrenewable resources because reserves are being depleted much faster than new ones are being made. Based on proven reserves in 2020, it is estimated that coal will last another 139 years, oil 56 years, and natural gas 49 years (ourworldindata).
For over a century people have been forecasting the imminent exhaustion of commercially extractable hydrocarbon reserves, but all such predictions have come to nothing because new reserves are constantly being discovered and new ways are being found to access previously inaccessible resources. Nevertheless, hydrocarbons are finite resources so it makes sense to look for alternatives. The weakest reason for doing so is the supposed urgent need to reduce greenhouse gas emissions in order to prevent ‘catastrophic man-made global warming’ (see Climate delusions).
A very significant development is the ongoing discovery of very ancient and continental rocks in the world oceans. These finds, along with various other lines of geological and geophysical evidence, indicate that large areas of the present ocean floors were once continents, and contradict the plate-tectonic theory that the ocean crust is nowhere older than 200 million years and has an entirely different (basaltic) composition than granitic continental crust (Sunken continents; Vasiliev & Yano, 2007). Dong Choi (2007) wrote:
The new picture – that continental ‘oceanic’ crust (or sunken continents) underlies the Mesozoic-Cenozoic basins and basalts – is a great gift for the oil industry. They now have positive scientific grounds for exploring deep-sea sedimentary basins. Currently, hydrocarbons are produced in 1,800 m of water off Brazil and exploration is progressing in much deeper waters worldwide ... In the coming 10 to 15 years, basins with 3,000 to 4,000 m of water will become the most active area for exploration and exploitation.
According to the controversial abiogenic theory, some petroleum may originate from carbon-bearing fluids that migrate upward from the earth’s mantle, rather than from ancient biomass, which would mean that there is far more petroleum and natural gas on earth than commonly thought. Its proponents cite the presence of methane on Saturn’s moon Titan and in the atmospheres of Jupiter, Saturn, Uranus and Neptune as evidence of the formation of hydrocarbons without biology. The theory has some laboratory data to support it (sagepub; viewzone; carnegiescience; wnd).

In 2023 coal, oil and natural gas accounted for 81.5% of the world’s primary energy consumption and 60.7% of global electricity generation. Global energy consumption is currently growing at about 2% per year, but fell by 1.6% in 2009 due to the financial crisis, and by 3.5% in 2020 due to the Covid lockdowns (ourworldindata). The reason for the continued dominance of hydrocarbons is that they can provide reliable power from relatively small areas, at affordable prices and in the enormous quantities required. Unlike wind and solar farms, gas, coal and nuclear power plants provide dispatchable energy, meaning that the supply can be readily increased or decreased to match demand.

Global energy consumption by source. (ourworldindata)

Global electricity generation by source. (ourworldindata)
Every source of energy production takes a toll on the environment and the aim should be to minimize it. The combustion of hydrocarbons releases air pollutants, such as nitrogen oxides (NOx), sulphur dioxide, volatile organic compounds, and heavy metals. It also releases carbon monoxide, which is highly toxic, and carbon dioxide, which is nontoxic but which in recent times has been demonized as an evil, ‘polluting’ gas. In addition, hydrocarbon burning generates sulphuric, carbonic and nitric acids, which fall to earth as acid rain, and it releases radioactive materials, notably uranium and thorium.
Coal-fired plants emit mercury, lead, chromium and arsenic, which are very damaging if ingested in sufficient quantities. Exposure to mercury, a neurotoxin, has been linked to higher risks of autism, impaired cognition and neurodegenerative disorders (e.g. Alzheimer’s disease). In 2011, coal-fired power plants in the United States emitted an estimated 41-48 tons of mercury per year, but this accounted for less than 0.5% of all the mercury in the air. For comparison, US forest fires emit at least 44 tons per year, cremation of human remains discharges 26 tons, Chinese coal-fired power plants eject 73 tons, and volcanoes, subsea vents, geysers and other sources spew out another 9000-10,000 tons per year (wmbriggs). The long-term effects of air pollution from large-scale coal combustion are highly uncertain: estimates of the number of premature deaths caused by emissions from a 1 gigawatt coal-fired power plant range from 0.07 to 400,000 (Smil, 2008a, 350).
The dense smog that coal burning once caused in Western cities is now plaguing industrializing countries, such as India, where 11 of the world’s 20 most polluted cities are located (2024). It seems that a country only begins to seriously tackle air pollution once it reaches a certain level of prosperity. Many coal plants now ‘scrub’ the smoke coming out of their stacks to remove sulphur and fly ash; the millions of tonnes of fly ash and sulphate-rich scrubber sludge used to be landfilled, but nowadays a large proportion is put to various uses in agriculture and industry.Coal mining techniques such as strip mining and mountaintop removal are cheaper than underground mining but result in huge swaths of blighted landscape. More than 1 million acres of Appalachian mountains and forest have been levelled in the US since the mid-1990s, with the connivance of Congress (Bryce, 2008, 296).

Coal-fired power station at West Burton, Nottinghamshire, England. Situated on a 1.7 km2 site, it had an installed capacity of 2000 MW and provided electricity for around 2 million people. The grey/white stuff coming out of the huge cooling towers is not smoke, and certainly not CO2 (which is colourless), but steam/water vapour condensing in the air. The two chimneys in the centre of the picture are emitting smoke and CO2. The plant was closed in 2024.
Integrated gasification combined cycle (IGCC) technology turns coal into gas (syngas) and removes impurities, resulting in lower emissions of sulphur dioxide, particulates (fine particles, such as soot), and mercury. Excess heat from the primary combustion and generation passes to a steam cycle, resulting in improved efficiency compared with conventional pulverized coal. The main problem facing IGCC is its extremely high capital cost.
Despite all its negative characteristics, coal continues to be used on a vast scale for a simple reason: cost. In the developing nations in particular, coal-fired power plants are often the most affordable option for power generation, especially in countries with large coal reserves, like China, India and Indonesia.
Extracting, transporting, processing and burning oil can have many harmful effects on humans and the environment – e.g. through oil spills, air pollution, and accidents at refineries, pipelines and drilling rigs. It is, however, superior to coal in nearly every respect – it has a higher energy density and power density, burns more cleanly, is easier to transport, and its uses are virtually limitless (for instance, hydrocarbons are essential feedstocks for plastics and industrial chemicals). For all its problems, oil provides unprecedented mobility, comfort and convenience. It supplies the fuel for the two prime movers in the modern industrialized world: the diesel engine and jet turbine, which came into widespread use in the 1950s and 60s.
Jet engine.

General Electric’s GE90-115B turbofan aircraft engine,
one of the most powerful gas turbine engines in the world.
Global commerce depends on global transportation, 90% of which is fuelled by oil. Oil’s share of the primary energy market has declined from 48% in 1973 to 32% in 2023, but the world will continue using it for a long time to come. In 1980 official US oil reserves stood at 30 billion barrels. From 1980 to 2020, the US produced more than 100 billion barrels, but official reserves are still listed as about 35 billion barrels (Mills, 2022).
Since the start of this century the estimated recoverable natural gas resources worldwide have risen sharply, partly due to improved technologies – hydraulic fracturing (fracking) and horizontal drilling – which can extract vast quantities of gas from shale deposits. Fracking involves drilling vertically and horizontally into the earth, and directing a high-pressure mixture of water and sand, along with small quantities of chemicals, at a rock layer to release the gas inside. It entails a risk of groundwater contamination. Some countries have banned fracking or imposed a moratorium, including Germany, France, the Netherlands, Slovenia and Bulgaria.
In the pre-Covid decade of shale expansion, the growth in energy supply from shale technology was nearly double that of the entire world’s expansion of solar and wind technology combined (Mills, 2022). In 2020 proven gas reserves were enough to last about 50 years, but most countries do not yet include shale gas deposits in their calculations.
Natural gas (methane) is cleaner than oil and coal. During combustion, it releases no particulates, nor does it release significant quantities of serious pollutants such as sulphur dioxide or nitrogen oxides. It emits about half as much CO2 as coal, which means that it is less ‘green’ in this respect, since CO2 is plant food and higher concentrations are visibly greening the earth (see next section).
The best single-cycle gas turbines – which discharge their hot gas – can convert about 42% of their fuel to electricity, whereas combined-cycle gas turbines use the turbines’ hot exhaust gases to generate steam for a steam turbine, enabling them to convert as much as 60% – making them the most efficient electricity generators. Thanks to their compactness, mobile gas turbines generate electricity with power densities higher than 15 kW/m2 and large (>100 MW) stationary setups can easily deliver 4-5 kW/m2 (Smil, 2010b).

Pratt & Whitney’s 60 MW SwiftPac gas turbine with a footprint of 700 m2. (masterresource)
The reliance on biomass in Asia, Latin America and Africa is a major cause of deforestation, desertification and erosion. About 2.1 billion people worldwide rely on fuels such as straw, wood, dung or coal to cook their meals. These low-quality fuels, combined with inadequate ventilation, often result in the living area being filled with noxious pollutants, including soot particles, carbon monoxide, benzene, formaldehyde, and even dioxin. As already mentioned, 3.2 million people die prematurely every year due to household air pollution. A good solution to this problem is cleaner-burning, high-energy-density liquefied petroleum gas (LPG), such as propane and butane, and also kerosene (paraffin).
According to the UN’s Intergovernmental Panel on Climate Change (IPCC), most of the warming since 1850 and all the warming since 1950 are the result of anthropogenic greenhouse gas emissions, and unless drastic measures are taken to slash emissions and switch to alternative energy sources, the result will be dangerous, runaway global warming and a drastic increase in extreme weather disasters. These claims are based on shoddy science and alarmist hype. Compared with solar cycles, ocean cycles, the water cycle, and orbital, geological and tectonic factors, CO2 plays a minor role in the changing climate, and the increasing atmospheric CO2 concentration is largely caused by emissions by the oceans and terrestrial biosphere resulting from rising temperatures (see Climate delusions; Extreme weather).
Far from being a pollutant, CO2 is a colourless, odourless, tasteless, benign gas that is a vital ingredient in photosynthesis and plant growth, and essential to life on earth. That is why farmers artificially increase the CO2 concentration in glasshouses to between two and three times the current atmospheric level, often by piping in CO2 from nearby power plants. Atmospheric CO2 needs to be above 150 parts per million (ppm) to avoid harming green plants, and would only become harmful to humans at levels over 5000 ppm (Happer, 2011). The level in early 2025 was 426 ppm.
Doubling the air’s CO2 concentration causes the productivity of herbaceous plants to rise by 30 to 50% and the productivity of woody plants to rise by 50 to 75% (Idso & Idso, 2011). In addition, atmospheric CO2 enrichment typically increases the efficiency of plant nutrient use and water use. The IPCC’s Sixth Assessment Report (TS, 80) grudgingly admits that CO2 enrichment has led to a longer growing season in much of the northern hemisphere outside the tropics and to ‘a global-scale increase in vegetation greenness of the terrestrial surface’, i.e. global greening.

Global greening based on leaf area index (LAI). Yellow and blue indicate a positive LAI trend (yellow = negative trend in LAI growth rate; blue = positive). Red and green indicate a negative trend (red = negative trend in LAI growth rate; green = positive). (sciencedirect)
Just as in the Middle Ages Catholics believed they could avoid punishment for their sins by buying indulgences from the Church, so emissions of CO2 are nowadays regarded as a sin, for which we can buy a sort of environmental indulgence in the form of carbon credits. Carbon emissions trading (also known as ‘cap-and-trade’) is deeply flawed, as even some environmentalist groups have admitted.
The global carbon market was worth US$ 949 billion in 2023, but most of this money circulates among banks, brokers speculating on price changes, and companies hedging their risks, and little is available for funding actual emission reductions (Kill et al., 2010, 105-6). In the EU Emissions Trading System (ETS) the initial allocation of free permits enabled some of Europe’s largest greenhouse-gas emitters to reap huge windfall profits; the 10 companies benefiting most gained €3.2 billion in 2008-2012. During this period, European power companies earned windfall profits of between €23 and €71 billion by passing on nonexistent costs for permit purchases to consumers. In 2008 and 2009, ETS fraud resulted in VAT revenue losses of €5 billion (Kill et al., 21-2, 26, 39). The ETS continues to be a magnet for fraud, money laundering and other crimes (Weishaar, 2016).
The 1992 United Nations Framework Convention on Climate Change required the signatories to reduce greenhouse gas emissions. It was extended by the Kyoto Protocol, signed in December 1997. Some developed nations did cut their emissions, but by the time the first commitment period ended in 2012, global anthropogenic emissions were 47% higher than in 1997. From 1992 to 2023 emissions rose by 68%.
The earth is now said to be 1.2° warmer than in the late 1800s. According to the climate hysteria cult, ‘the science’ shows that further warming must be kept below 1.5°, otherwise the globe will become unlivable – a moronic claim. Under the 2015 Paris Agreement, greenhouse gas emissions must peak before 2025 (which has not happened), and must be reduced by 43% by 2030 (compared to 2019 levels) and reach net zero (‘carbon neutrality’) by 2050, which means reducing them to a level no greater than the amount removed from the atmosphere by carbon sinks or carbon capture. Such goals are utterly delusional (unless global economic collapse occurs). If countries achieve the commitments they have already made, global emissions will fall by just 2.6% by 2030. A survey in early 2025 found that 44% of energy industry executives believe that net zero will not be achieved until 2070 or later.
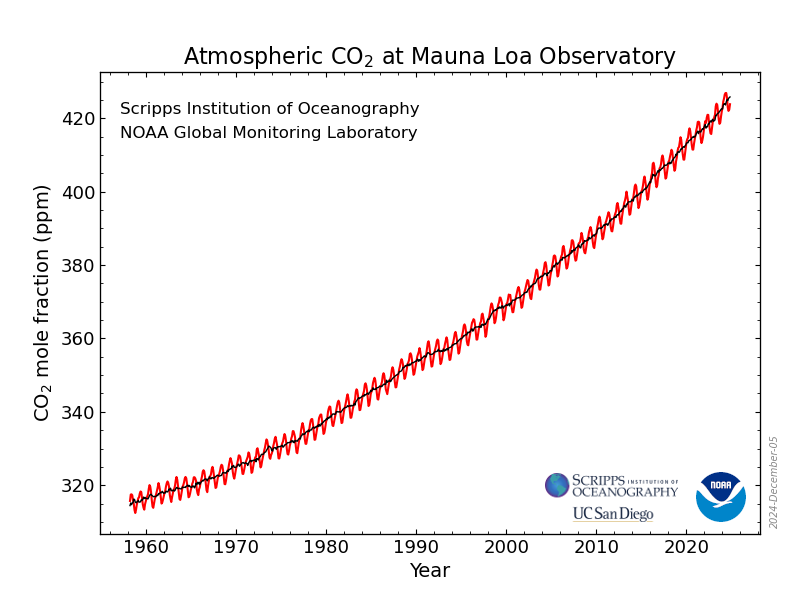
Average annual atmospheric CO2 concentrations measured at Mauna Loa show a steady rise since 1958, even in years when global human emissions temporarily declined (1980-82, 1992, 2009, 2020). In 2020, Covid lockdowns cut emissions by 5.5%, but the Mauna Loa level still rose by 2.56 ppm. The 1992, 1997 and 2015 climate agreements have all had zero effect on atmospheric CO2. (noaa.gov)
One way of reducing CO2 emissions from industrial and power plants is carbon capture and storage (CCS). The captured CO2 is typically transported by pipelines and stored in deep geological formations. Globally, about 70% of the 149 projects proposed to be operational by 2020, aiming to store 130 Mt of CO2 annually, were not implemented, due to high costs and technological problems. If all plans from the first wave of CCS expansion had been realized, today’s operational capacity would be around 270 Mt per year, but in reality it is only 40 Mt per year, or about 0.1% of total emissions.
A country’s greenhouse gas emissions are defined as those emitted on its own territory. Some countries choose to reduce emissions by switching from domestic manufacturing to importing goods from countries like China and India, but factories in these countries often rely on coal-powered electricity, resulting in an overall emissions increase. High energy prices in European countries are also causing companies to move their operations to cheaper countries, such as China, India and the United States.

We are now about halfway between the start of decarbonization in 1997 and the year 2050, when net zero is supposed to be achieved. From 1997 to 2023 the share of hydrocarbons in the world's primary energy consumption declined by only 4.2 percentage points, from 85.7% to 81.5%, at a cost of about $5 trillion in green subsidies. But this was accompanied by a massive absolute increase in hydrocarbon combustion: in 2023 the world consumed 55.8% more hydrocarbon energy than it did in 1997. The absolute cuts in CO2 emissions in Europe (-20.4%) and North America (-8.5%) were far surpassed by massive increases in emissions from the two largest industrializing nations: China (whose emissions rose 3.4 times), and India (whose emissions rose 3.6 times) (ourworldindata).
Even if there was no further increase in CO2 emissions, they would have to be cut by 82% by 2050 to achieve net zero. This would cost wealthy countries at least 20% of their annual GDP (Smil, 2024). It would also require around 700 quintillion (i.e. billion billion) joules of new noncarbon energies by 2050, along with about 5 billion tons of steel, a billion tons of aluminium, over 40 times as much lithium as is currently mined, and up to 25 times the amount of graphite, cobalt and nickel, precipitating steep price rises.
Converting energy-intensive processes such as iron smelting, cement production and plastics production to nonhydrocarbon alternatives would require new technological breakthroughs. By 2050, the making of steel (without coke) and ammonia (without natural gas) would require the production of 135 million tons of ‘green’ hydrogen every year; one kilogram of hydrogen is equivalent to about 33 kWh of electricity, but its production by electrolysis of water (using green electricity) requires about 50 kWh/kg! Moreover, global energy demand is set to grow by at least 10-15% during this period. No amount of political posturing can alter these harsh realities.
If all nations were to achieve net zero by 2050, this would cost around 2 quadrillion dollars ($2 × 10¹⁵), equivalent to 20 years’ global annual GDP. The result would be to reduce the global temperature in 2050 by no more than 0.1°C (scienceofclimatechange, 6-7; Abbot & Marohasy, 2024, 89). Adaptation to the ever-changing climate is the most rational choice. At present, the world is in the grip of a green mass psychosis, though many participants are only playing along to avoid being ostracized. According to climateactiontracker (run by climate fanatics), no country in the world is taking sufficient action to comply with the Paris Agreement. That is certainly good news.
Renewable energy means energy derived from natural sources that are replenished faster than they are consumed. The main renewable energy sources are solar power, wind power, hydroelectricity, geothermal energy, and biomass. A popular delusion nowadays is that by expanding the use of these energy sources we will be able to stop the climate from changing.
Local residents and environmentalists often oppose ‘green’ energy sources: e.g. people living near proposed wind farms often oppose them because they disfigure the landscape and kill birds; conservationists have opposed hydropower dams because they disrupt river ecosystems, kill spawning fish populations, and release large amounts of methane from decaying vegetation along riverbeds; a lawsuit filed against two proposed geothermal plants in California stated that they would introduce highly toxic acids into geothermal wells and turn the lands into ‘an ugly, noisy, stinking wasteland’; and the construction of a solar power plant in California was held up due to concerns about the welfare of a lizard (realclearscience; Bell, 2011).
As already mentioned, hydrocarbons and nuclear energy have power densities 10 to 10,000 times greater than those of renewable energy sources, which therefore require vast areas of land (or water). David MacKay (2009, 112, 167) gives the following figures for the United Kingdom:
| Power source | Power density (W/m2) |
| Nuclear Solar PV panels Hydroelectric Onshore wind Offshore wind Tidal stream Tidal pools Biomass Corn for bioethanol Rainwater (highlands) Geothermal |
1000 |
Solar power and wind power reduce location flexibility because the facilities have to be located in the sunniest or windiest regions, often requiring the addition of hundreds or thousands of kilometres of power lines to transmit electricity to distant towns and cities. The biggest problem is their variability, which means they are not dispatchable, i.e. power generation cannot be ramped up or down to meet the changing demand. As a result, they have to be backed up by gas-fired plants or, in less wealthy nations, coal-fired plants, making wind and solar more inefficient and expensive than conventional power generation. A survey of US utilities revealed that wind power reduces the installed power capacity at thermal power stations by 3 to 40% of rated wind capacity, with many falling in the 20 to 30% range (Cleveland, 2011). The alternative is to invest in energy storage capability, such as pumped hydroelectric power, compressed air, flywheels or batteries – which will also add significantly to the overall cost.
By contrast, hydro, biomass and geothermal are dispatchable. Like conventional power plants, they use rotating synchronous generators to produce alternating-current electricity (as used by the electricity grid), whereas wind, solar and battery storage systems produce direct current, which has to be converted to alternating current using an inverter. This means that hydro, biomass and geothermal operate in synch with the grid and support it rather than destabilizing it. Overcoming this problem in the case of wind and solar energy would be very costly and require technological innovations (Schussler). Although Albania, Paraguay, Nepal, Bhutan, Ethiopia and the Democratic Republic of Congo produce between 96% and 100% of their energy from hydro, this energy source is not readily available in most countries, while geothermal energy depends on local geology (ourworldindata).
In July 2008 Al Gore called on the United States to produce 100% of its electricity from renewable energy and clean, carbon-free sources within 10 years. Vaclav Smil (2008b) commented:
To think that the United States can install in 10 years wind and solar generating capacity equivalent to that of thermal power plants that took nearly 60 years to construct is delusional. ... It took 45 years for the US to raise its crude oil use to 20 percent of the total energy supply; natural gas needed 65 years to do the same. As for electricity generation, coal produced 66 percent of the total in 1950 and still 49 percent in 2007 ...
By 2023 renewables accounted for only 9% of US energy consumption and 21.4% of US electricity generation. Since 2019 the US has been a net energy exporter, and in 2023 it produced about 77% of the primary energy it consumed (eia.gov). In January 2025 the Trump administration announced that the US would withdraw (for the second time) from the Paris Agreement. This is part of a wider trend towards governments and companies deprioritizing net-zero practices, largely due to cost pressures.

(eia.gov)
In 2023, gas, coal, oil and nuclear power accounted for 78.0% of the European Union’s energy consumption, 83.8% of China’s energy consumption, 90.3% of India’s energy consumption, and 93.7% of Russia’s energy consumption. The European Green Deal aims to turn Europe into the first ‘carbon-neutral’ continent. To achieve net zero, the EU would need to spend €1.3 trillion every year until 2030, and then €1.5 trillion every year until 2050. But these amounts do not include all the associated costs. For instance, €100 billion would need to be invested annually until 2030 to meet the requirement that 40% of European transition tech should be made in the EU (Bruegel). The transition is already making life in the EU far more expensive and destroying business competitiveness. Political instability in countries like Germany, Romania and France in early 2025 revealed how fragile public support already is (oilprice).
By 2023 coal, gas, oil and nuclear supplied 53.6% of UK electricity, while wind and solar supplied 32.9%, and hydro and other renewables supplied 13.5% (gov.uk). Oil, gas and coal accounted for 74.2% of the UK’s overall energy consumption in 2023 (ourworldindata). David MacKay (ch. 19) argued that, taking into account likely public and environmental objections, renewables could not produce more than 18 kWh per day per person, whereas the average energy consumption in the UK is 77 kWh per day per person (2023). Even under favourable assumptions, the cost of achieving net zero in the UK would be between £1.4 and £3 trillion and would far outweigh the benefits. With current costs and efficiencies, the price tag would be £10 trillion – more than 10 times the benefits (Montford, 2024). The policy is therefore irrational.
In 2023 renewable energy accounted for 42.7% of Denmark’s energy consumption and 87.6% of its electricity generation; Denmark is therefore seen as a model for other countries to follow. However, sometimes it has far too much electricity and sometimes too little. When it produces more electricity than can be used, the Danes sell it to their neighbours, often at subsidized, below-market rates. And when it doesn’t produce enough, large quantities of hydropower are imported from Norway and Sweden. Without these neighbours, the stability of its power supply would be in serious trouble (Hansen, 2024).
Denmark has the sixth-highest household electricity price in the EU. Thanks to its ill-conceived energy transition (Energiewende), Germany has the highest household electricity price in the EU and the third-highest in the world (globalpetrolprices, June 2024). By the end of 2025 it will have spent €520 billion on its green crusade, but it is failing to meet its targets. In 2000, hydrocarbons accounted for 85% of Germany’s energy consumption. By 2023 the figure had only fallen to 75%.
The steep rise in electricity prices in Europe is due to huge subsidies for renewable energy, the cost of new infrastructure for transmitting wind/solar-generated electricity, the cost of keeping conventional power plants available as backup for when the wind is not blowing or the sun is not shining, and the decision to end dependence on cheap Russian oil and gas. In the UK, ‘environmental levies’ (green subsidies) amounted to £9.9 billion in 2023-24 and will rise to £12.9 billion in 2025-26. It has the highest business electricity price in the world (globalpetrolprices, June 2024).

The rapid expansion of wind and solar energy in Europe has resulted in oversupply at peak production hours, resulting in surplus energy being sold at a loss with increasing frequency; this was the case for 7841 hours during the first eight months of 2024 (oilprice). In the UK, market prices for electricity are expected to be negative for nearly 10% of the time by 2030. Price volatility explains why a government-run offshore wind farm auction in Denmark failed to receive a single bid in December 2024. The same thing happened a year earlier in the United Kingdom. Danish energy trading firms are exploiting price volatility to make exorbitant profits by using computer algorithms to buy and sell energy contracts based on forecasted weather conditions. In 2025 the Danish company Ørsted, the world’s largest offshore wind power developer, called on European governments to increase their financial support for the offshore wind industry to avoid a ‘downward spiral’ (ft.com).
Despite improved performance and lower prices, batteries are still not a viable solution for storing electricity for an entire nation even for a few days. Building enough batteries to store just 12 hours of electricity for the United States would cost $1.5 trillion, whereas $100 billion worth of hydrocarbon-based backup can keep lights on for weeks. Using wind, solar and battery technologies to provide the same amount of energy as machines that burn oil, natural gas or coal would require increasing the use of copper by 300%, lithium by 4200%, graphite by 2500%, nickel by 1900%, and rare earths by 700%, along with at least 1000% more steel, concrete and glass (Mills, 2022).

A battery energy storage system (BESS) site in Cottingham, East Yorkshire, England. It can hold enough electricity to power 300,000 homes for two hours (bbc). As of December 2024, Britain had a 4.5 GW BESS fleet, second only to the US with a total of 15.5 GW, and it plans to expand it to 22 GW by 2030, despite local opposition.
By the end of 2023 the EU had installed around 62 MW of electrolyzer capacity for producing ‘green’ hydrogen, but this is only 0.1% of its 2030 target (oilprice). Green hydrogen made by electrolyzing water using renewable energy is nearly four times more expensive than ‘grey’ hydrogen made from natural gas. There is a serious shortage of customers willing to sign uptake agreements, so it remains to be seen how many of the 2070 green hydrogen plants currently planned worldwide end up being built.
If we consider only the flux of the wind’s kinetic energy moving through the area swept by wind-turbine blades, the power density is commonly above 400 W/m2 in the windiest regions. But because wind turbines have to be spaced 5 to 10 rotor diameters apart to minimize wake interference, the power density expressed as electricity generated per square metre of the area occupied by a large wind farm is a small fraction of that figure. Moreover, a wind turbine’s rated capacity (the power generated in optimal wind conditions) has to be reduced by the capacity factor (or load factor), i.e. the percentage of time that the wind allows turbines to work optimally. This figure is around 30% for the UK, 22% for the Netherlands, and 19% for Germany (MacKay, 2009, 267). This reduces year-round average power densities for large-scale wind generation to no more than 2 W/m2.

Wind farm at Ingbirchworth, West Yorkshire, England.
Stuart Young Consulting (2011) found that from November 2008 to December 2010 the average output of UK wind farms metered by the national grid was only 24% of rated capacity. During that period, wind generation was below 20% of capacity more than half the time, and below 10% of capacity over one third of the time. At each of the four highest peak demands of 2010, wind output was only 4.7%, 5.5%, 2.6% and 2.5% of capacity. The report concluded that wind cannot be relied upon to provide any significant level of generation.

Plans in 2011 to erect 800 giant wind turbines, up to 415 ft (126 m) high, in the unspoilt hills of mid-Wales ran into stiff opposition. The total cost of the project, including 100 miles of steel pylons to carry the electricity to the national grid, would have been £2 billion. The turbines would produce an average of around 300 MW. By contrast, a new gas-fired power station at Langage near Plymouth cost £400 million, produced 895 MW, and covered just a few acres. (telegraph)
A typical megawatt of reliable wind power capacity requires about 32 times as much concrete and 139 times as much steel as a typical gas-fired power plant (Bryce, 2008, 90). Installing 9 terrawatts (trillion watts) of new wind power by 2050 would require more than 3 billion tons of concrete, equal to two-thirds of annual global production, and 1.2 billion tons of metals (mostly steel), equal to the annual output of blast-furnace iron (Smil, 2023). Moreover, it is currently impossible to smelt billions of tons of iron, produce billions of tons of concrete, produce tens of millions of tons of rotor plastics and supply millions of tons of lubricants without the use of hydrocarbons.
Wind turbines tend to have shorter lives than expected, especially in offshore environments, repairs are costly, and recycling their large structural components is challenging, if not impossible. The cost of dismantling a single turbine is over half a million dollars. In addition, wind-turbine magnets (and also solar panels and computers) typically contain neodymium and other rare-earth metals. The three main producers of rare earths are: China (240,000 tonnes/year), the United States (43,000 tonnes/year) and Myanmar (38,000 tonnes/year).

Artificial lake at Baotou, China, used for dumping toxic, radioactive waste from the city’s rare-earth processing plants. The region has over 37.8% of the world’s reserves of rare-earth metals, including neodymium. (bbc)
Cattle can graze and crops can be grown beneath wind turbines but humans cannot live close to them because the low-level noise caused by the massive blades disturbs sleep patterns and can cause headaches, dizziness and other health problems. There have been 229 recorded fatalities associated with wind farms since the year 2000. In 2020, there were over 300 accidents caused by wind turbines in the United Kingdom, eleven of which resulted in human fatalities. The worldwide mortality rate for wind power was about 0.15 deaths per terrawatt-hour (TWh) in 2000, but is now put at only 0.04, compared to 24.6 for coal (including estimated deaths from pollution).

Wind turbine on fire at the Gross Eilstorf wind farm, Germany, 2012.
Most incidents are due to blade failure, with whole blades or pieces of blade being thrown up to 1300 metres. That is why there should be a buffer zone of at least 2 km between turbines and residential areas. Fire is the second most common cause of accidents: an estimated 1 in 2000 wind turbines catch fire each year. Because of the turbine height, the fire brigade can do little but stand and watch. The third most common cause is structural failure. Some incidents involve ice being thrown from the blades for up to 140 m. Around 1.17 million birds, including endangered species, are killed by wind turbines in the United States every year.
Solar energy is the only essentially unlimited renewable resource. It can be harnessed and used in different ways:
- Trees, plants and vegetation absorb solar energy through photosynthesis and store it in chemical form. This energy is consumed directly when these materials are burned as fuel, or eaten by humans and animals, or it may be turned into biofuels, chemicals or building materials.
- By means of solar thermal collectors (e.g. on roofs), sunlight can be used for direct heating of buildings or water.
- Photovoltaics (PV) converts solar radiation directly into electricity by means of solar panels composed of cells containing a photovoltaic material (e.g. silicon). The concentration of sunlight onto photovoltaic surfaces is known as concentrated photovoltaics (CPV).
- Concentrated solar power (CSP) uses lenses or mirrors to concentrate a large area of sunlight onto a small area; the concentrated light is then converted into heat which drives a heat engine (usually a steam turbine) connected to an electrical power generator.
Covering the south-facing roof of homes with photovoltaics may provide enough electricity to cover a large share of average electricity consumption, but roofs are not big enough to make a huge dent in our total energy consumption (MacKay, 2009, 40). When the sun goes behind clouds, photovoltaic production falls roughly 10-fold. Moreover, this method is less effective for two- or three-storey homes and high-rise buildings.
Solar cells have a range of efficiencies, but the power densities of all types of solar power generation are well below those of conventional energy sources. Nowadays the best research cells have efficiencies approaching 50% (for multijunction concentrators), this being the percentage of solar energy converted into usable electricity. However:
actual field efficiencies of PV cells that have been recently deployed in the largest commercial parks are around 10%, with the ranges of 6-7% for amorphous silicon and less than 4% for thin films. A realistic assumption of 10% efficiency yields 17 W/m2 as the first estimate of average global PV generation power density, with densities reaching barely 10 W/m2 in cloudy Atlantic Europe and 20-25 W/m2 in subtropical deserts. (Smil, 2010b)
So although the largest solar PV parks generate electricity with power densities roughly 5 to 15 times higher than for wood-fired plants, this is at best 1/10 and at worst 1/100 of the power densities of coal-fired electricity generation.
No dramatic near-term improvements are expected either in the conversion efficiency of PV cells deployed on MW scale in large commercial solar parks or in the average capacity factors. But even if the efficiencies rose by as much as 50% within a decade this would elevate average power densities of optimally located commercial solar PV parks to no more than 15 W/m2. ...
[O]ptimally located CSP plants will operate with power densities of 35-55 W/m2 of their large heliostat [mirror] fields and with rates no higher than 10 W/m2 of their entire site area. (Smil, 2010b)
Environmental groups have criticized solar parks for taking up too much desert land, thereby displacing certain animal and reptile species. The use of photovoltaic collectors is also challenged because they contain highly toxic heavy metals, explosive gases and carcinogenic solvents that present end-of-life disposal hazards (Bell, 2011).

SunEdison’s 6.2 MW Alamosa Solar PV Farm, Colorado.
Assuming that concentrating solar power in deserts delivers an average power per unit land area of about 15 W/m2, a total desert area of 1 million square kilometres would have to be covered with solar cells to provide the world’s total power consumption of 15,000 GW. To supply everyone in Europe and North Africa with an average European’s power consumption would require a desert area of 360,000 square kilometres, equal to the area of Germany, or one a half times the size of the UK (MacKay, 178).
Biomass energy, or bioenergy, is energy from plants and plant-derived materials. Wood is still the largest biomass energy resource in use today, but other sources include food crops, grassy and woody plants, residues from agriculture or forestry, oil-rich algae, the organic component of municipal and industrial wastes, and the fumes (methane gas) from landfills. As well as being converted into electricity, biomass can be converted into liquid fuels (biofuels) for transportation purposes. The two most common biofuels are bioethanol (made from corn and sugarcane) and biodiesel (made from vegetable oil, animal fat or recycled cooking grease). Brazil is the largest producer of bioethanol, while the European Union is the largest producer of biodiesel.
Using biomass as a fuel releases CO2 and air pollutants such as carbon monoxide, nitrogen oxides, volatile organic compounds, and particulates, in some cases at levels above those from coal or natural gas (wikipedia). The main problem with biomass is its low energy density and power density. The best power density of energy crops in Europe is about 0.5 W/m2. If 75% of the UK were covered with bioenergy crops (i.e. the entire area currently devoted to agriculture), and using a very conservative figure of 33% for overall losses along the processing chain, this would still generate only 24 kWh of electricity per day per person – one-third of total energy consumption (MacKay, 2009, 43-4).
The annual global consumption of gasoline (petrol) and diesel fuel in land and marine transport, and kerosene in flying, is about 75 exajoules (million trillion joules). Even if the most productive biomass alternative (Brazilian ethanol from sugarcane at 0.45 W/m2) could be replicated throughout the tropics, the total land required for producing transportation ethanol would be about 550 million hectares – just over one-third of the world’s cultivated land or nearly all the agricultural land in the tropics (Smil, 2008a, 360-1).
The power density of bioethanol made from corn is only 0.22 W/m2. This means that about 390 million hectares (just over twice the entire cultivated area of the United States) would be required to satisfy the US demand for liquid transportation fuel. Moreover, if all the machinery required for ethanol production were fuelled with ethanol, and the combustion of crop residues was used to generate heat for distilling purposes, the power density would drop to, at best, 0.07 W/m2. The US would then need to plant 1.2 billion hectares (over six times its entire arable area) with corn for ethanol fermentation (Smil, 2008a, 361). About 40% of the US corn harvest is used for ethanol, but this accounts for only around 10% of US gasoline consumption.
Ethanol can be used as a fuel for vehicles in its pure form, but it is usually added to gasoline to increase octane and reduce emissions. Tests show that E85 (85% ethanol) reduces fuel economy by 28% compared with regular gasoline (10% ethanol). On average a barrel of crude oil (42 gallons) yields about 20 gallons of gasoline. Other products include butane, jet fuel, diesel fuel, fuel oil, and asphalt. Ethanol can replace gasoline, but not ‘middle distillates’ like diesel fuel and jet fuel.
Worldwide, about 10% of all grain is turned into biofuel. A 2008 World Bank report concluded that up to 70-75% of the rise in food prices from 2002 to 2008 was due to ‘large increases in biofuels production in the U.S. and EU’ and ‘the related consequences of low grain stocks, large land use shifts, speculative activity and export bans’. A more recent study states:
Globally, the biofuel industry consumes an enormous quantity of food commodities every year (cereal grains, vegetable oils and sugar crops). If these crops were dispatched for human consumption they could meet the basic minimum energy requirements of about 1.6 billion people. ...
In the early 2000s, government policy in North American and the European Union started to target a major ramp up in biofuel production and use ... Since then, the world has been through three ‘food price crises’, first in 2007/08, then in 2010/12, and most recently 2021/23. In each of these crises, reputable analysts and experts have identified biofuel demand as a contributing factor. (Malins, 2023)

The rush to boost biofuel production has led to huge tracts of tropical forests in Malaysia and Indonesia being cleared to create palm plantations for biodiesel production – destroying unique plant and animal species and eroding fragile tropical topsoil (Manning & Garbon, 2009, 39). The EU intends to phase out palm oil-based fuels by 2030.
It is generally assumed that greater use of biofuels will reduce greenhouse gas emissions. However, clearing rainforests or grassland to grow more biofuel crops can result in an overall increase in atmospheric CO2, or ‘climate-warming pollution’, as ignorant alarmists call it. As already mentioned, CO2 enrichment is beneficial as it boosts photosynthesis and therefore bioproductivity. Algae for making biofuel are grown in water heavily enriched with CO2. Ponds in sunny parts of the US fed with CO2 concentrated to 10% have a power density of 4 W/m2. Without the concentrated CO2, algae productivity drops 100-fold (MacKay, 2009, 285).
To reduce hydrocarbon use, governments around the world are using financial incentives to promote the sale of electric vehicles, which do not emit CO2 or exhaust pollutants, though the electricity they consume may of course have been produced from hydrocarbons. In 2023, 18% of cars sold worldwide were electric: in the United States the figure was 10%, and in the European Union 22% (ourworldindata). In that year there were about 40 million electric cars on the roads – only 2.7% of the total number of cars – while ‘decarbonization’ of heavy road transport, shipping and flying had barely begun.
At present, all-electric cars are still hampered by long charging times (about 10 hours with a standard charger), a more limited driving range and a shortage of recharging stations. Although their refuelling costs are low, the high cost of their battery packs makes them significantly more expensive than conventional internal combustion engine (ICE) vehicles and hybrid electric vehicles (which combine an internal combustion engine with electric propulsion). Despite the cost of lithium batteries falling more than 10-fold in the past two decades, an electric vehicle still costs at least 50% to 70% more than a comparable standard car (Mills, 2022). However, the total cost of ownership of recent electric cars is said to be lower than that of equivalent petrol cars in the EU and US (but not yet China), due to lower fuelling and maintenance costs.
Gasoline holds 80 times as many watt-hours per kilogram as a lithium-ion battery, and ethanol holds more than 50 times as many (Bryce, 2008, 190). However, internal combustion engines are fairly inefficient at converting on-board fuel energy to propulsion as most of the energy is wasted as heat; they use only 15% of the fuel energy content to move the vehicle or to power accessories, while diesel engines can reach an on-board efficiency of 20%. Electric vehicles have an on-board efficiency of over 77%, they do not consume energy while at rest or coasting, and regenerative braking can capture as much as one-fifth of the energy normally lost during braking.

A Tesla Model S on fire after a roadway collision. Fires are far more common with ICE vehicles and most common of all with hybrid vehicles. However, EV fires burn hotter and longer than ICE fires, and are more difficult to extinguish. (eepower)
A UK study covering the period 2013-2017 found that pedestrians were twice as likely to be hit by electric or hybrid cars as by petrol or diesel vehicles, probably because electric vehicles are ‘less audible to pedestrians in urban areas’ (bmjgroup).
An electric vehicle needs a half-tonne battery to match the range of a dozen gallons (35 kg) of petrol. The batteries contain minerals such as cobalt, natural graphite, lithium, manganese, and nickel. About 90% of the world’s lithium comes from just three countries: Australia, Chile and China. Building an electric car requires 180 kg more aluminium and about 70 kg more copper than a petrol vehicle. About 250 tonnes of rock have to be dug up to obtain all the minerals required. Since the mining industry depends on hydrocarbons, driving electric vehicles doesn’t eliminate as much CO2 as is assumed and could even mean no reductions at all (Mills, 2022).
Another proposal is hydrogen vehicles. David MacKay (2009, 129-31) describes hydrogen as a ‘hyped up bandwagon’. Hydrogen, he says, ‘is not a miraculous source of energy; it’s just an energy carrier, like a rechargeable battery’. The energy needed to produce hydrogen by electrolysis is greater than what it delivers when converted to useful energy. Hydrogen is highly flammable and explosive, and difficult to store and transport safely. Battery electric vehicles (BEVs) are about 80% energy-efficient, while hydrogen fuel cell electric vehicles (FCEVs) are less than 40% energy-efficient. By the end of 2022, only 70,200 hydrogen vehicles had been sold worldwide, compared with 26 million plug-in electric vehicles.

A $1.1 million hydrogen bus goes up in flames after an explosion while refuelling at a state-of-the-art hydrogen station in California (July 2023). A spokesperson commented: ‘The technology is really good, there’s just gonna be things that are gonna come up with any fuel that you use.’ (bakersfieldnow)
All existing nuclear power plants involve nuclear fission, rather than nuclear fusion. In fission reactions heavy nuclei release energy when they split into medium-sized nuclei, while in fusion reactions light nuclei release energy when they fuse into medium-sized nuclei (as is believed to happen in stars). 1 kg of coal can generate 8 kWh of heat, 1 kg of mineral oil can generate 12 kWh, and 1 kg of uranium-235 can generate around 24,000,000 kWh (euronuclear).
Nuclear energy is a secure, dispatchable source of electricity and heat that can be deployed at scale with round-the-clock availability. It is set to undergo a resurgence in the coming decades, with over 40 countries in favour of expanding its use. There are currently 439 nuclear reactors in operation in over 30 countries, with a total capacity of 398 GW, and they provide 9% of global electricity (producing about 20% more electricity than wind power and 70% more than solar photovoltaics). A further 66 reactors are under construction, nearly all of them of Chinese or Russian design (world-nuclear).
France obtains 65% of its electricity from nuclear power, the European Union as a whole 24% (with one reactor under construction), the United States 19%, Russia 18% (with six reactors under construction), the United Kingdom 13% (with two reactors under construction), and China 5% (with 30 reactors under construction). Half of nuclear power projects under construction are in China, which is expected to overtake both the US and EU in installed nuclear power capacity by 2030. This is part of China’s drive to become carbon-neutral by 2060.
Nuclear projects have traditionally been hard to finance due to their scale, capital intensity, long construction times and technical complexity. That is why state-owned enterprises have traditionally played a key role in the nuclear industry. SOEs account for 100% of nuclear investment in China and Russia, 85% in emerging market and developing countries, and just under 50% in Western countries. China takes an average of only seven years to bring its large nuclear reactors into operation, while Western nations typically face substantial project delays and cost overruns. The levelized cost of electricity from nuclear energy (i.e. the average net cost over a plant’s lifetime) is $50-70 per megawatt-hour in China, $60-100 in the US, and $75-110 in Europe. This means that new nuclear plants could be added to electricity systems in those countries without raising the average cost of generation (iea).
A major new innovation is small modular reactors (SMRs), with investors planning up to 25 GW of SMR capacity, mainly to power data centres. There are already SMRs operating in Russia and China. In rich Western nations, the first SMRs are due to be completed around 2030. SMRs could account for 10% of all nuclear capacity globally by 2040 (iea).
Like hydrocarbon power stations, nuclear power stations are thermal plants: the heat energy released from the nuclear fuel turns water into steam which spins a turbine which drives an electric generator. There are many different reactor designs, using various fuels and coolants. Most reactors currently use uranium-235 (a rare uranium isotope whose nucleus contains 235 neutrons, making up 0.7% of all natural uranium) and discard the remaining U-238.
Breeder reactors, which generate more fissile material than they consume, use more common isotopes of uranium and thorium: U-238 (99.3% of all natural uranium) and Th-232. U-238 is converted to fissionable plutonium-239, generating about 60 times as much energy from the uranium, while Th-232 is converted to U-233. Whereas standard reactors use only about 1% of natural uranium, thorium can be completely burned up. Thorium reactors are safer than traditional nuclear reactors and there is no risk of meltdown. They produce little weapons-grade plutonium and also far less radio-toxic waste, which remains dangerous less long (300 years). China aims to begin operating the world’s first commercial thorium reactors by 2030.
![]()
Two new reactors at Leningrad II nuclear power plant, Russia. (world-nuclear)
Known uranium resources will last for about 90 years; further exploration will undoubtedly uncover more reserves, and if the cost of extracting uranium from seawater falls, there will be no danger of scarcity. Over 85% of uranium is produced in six countries: Kazakhstan, Canada, Australia, Namibia, Niger and Russia. Thorium is three to four times more abundant than uranium, but it is currently expensive to extract.
Greenhouse gas emissions from nuclear power plants are among the lowest of any electricity generation method. Lifecycle emissions (including construction, fuel processing and decommissioning) are comparable to those from wind, hydroelectricity and biomass. They are 15 times lower than those from natural gas generation, and 30 times lower than those from coal generation (world-nuclear). Some environmental groups still oppose nuclear power on the grounds that it is too expensive and dangerous. Greenpeace calls it ‘an unacceptable risk to the environment and to humanity’.
The volume of solid waste produced by nuclear reactors is relatively limited, but a small portion is highly radioactive. Nuclear waste from Britain’s nuclear power stations has a volume of just 0.84 litres per person per year, of which only 25 millilitres is highly radioactive. Over a lifetime the total amount of high-level waste would cover just one tenth of a square kilometre to a depth of 1 metre. By contrast, municipal waste in the UK amounts to 517 kg per year per person, and hazardous waste 83 kg per year per person (MacKay, 2009, 169-70, 367).
High-level radioactive waste (3% of the total volume of waste) is first stored in ponds or dry casks at the reactor site for 40-50 years, during which time its radioactivity decays by 99%. After that, long-lived waste is often disposed of deep (>400 m) underground. Some used fuel is reprocessed to recycle the uranium and plutonium it contains (reprocessing plants currently operate in France, Russia, India, Pakistan, Japan and China). This allows 25-30% more energy to be extracted from the original uranium ore, and reduces the volume of high-level waste by about 85%. Radioactive materials are also widely used in medicine, agriculture, research, manufacturing, nondestructive testing and minerals exploration. Unlike other hazardous industrial materials, the level of hazard (i.e. radioactivity) of all radioactive waste diminishes with time (world-nuclear).

Storage pond for used fuel at the Sellafield reprocessing plant in the UK. The plant is now closed.
The worst nuclear accident to date was the disaster at the Chernobyl nuclear power plant in the Soviet Union in April 1986. During a test in which important control systems had been switched off (in violation of safety regulations), a sudden power surge caused a steam explosion that ruptured the reactor vessel and led to the destruction of the reactor core and severe damage to the reactor building, which had no containment structure. The resulting plume of highly radioactive smoke drifted over large parts of the western Soviet Union and Europe. According to the United Nations Scientific Committee on the Effects of Atomic Radiation (UNSCEAR), 134 of the 600 workers who had been present received high doses of radiation and suffered from radiation sickness. 28 of them died in the first three months and another 19 died in 1987-2004 of various causes not necessarily associated with radiation exposure (unscear). As for the number of people who could eventually die of radiation exposure as a result of Chernobyl, a 2005 report gave an estimate of 4000 (who).
In 1979 one of the two units at the nuclear plant on Three Mile Island in the United States suffered a partial meltdown. The accident resulted in no deaths or injuries to plant workers or members of nearby communities, but the bad publicity held back the development of nuclear power in the US for decades.
On 11 March 2011 a massive magnitude 9 earthquake followed by a 14-metre tsunami led to a series of equipment failures and releases of radioactive materials at the Fukushima Daiichi nuclear power plant in Japan. Although the three reactors in operation shut down automatically after the earthquake, the tsunami knocked out the emergency generators – something that could have been avoided if the backup system had been better designed. This resulted in partial core meltdown. The plant’s six boiling-water reactors were second-generation technology, nearly 40 years old.
There were no deaths or cases of radiation sickness from the nuclear accident, but over 100,000 people were evacuated from their homes as a precautionary measure. Most Japanese people were exposed to additional radiation amounting to less than the typical natural background level of 2.1 mSv per year. People living in Fukushima prefecture are expected to be exposed to around 10 mSv over their entire lifetimes, while for those living further away the dose will be 0.2 mSv per year (world-nuclear).
After the disaster, Japan shut down all its nuclear reactors, which had produced 25% of its electricity; several reactors were gradually brought back online and by 2023 they were producing 23% of its electricity. The accident led many other countries to reevaluate their nuclear energy programmes. For example, under pressure from public opinion, the German government decided that by 2022 it would close all its 17 nuclear plants, which produced 26.1% of its electricity. However, nuclear energy is now making a comeback worldwide.
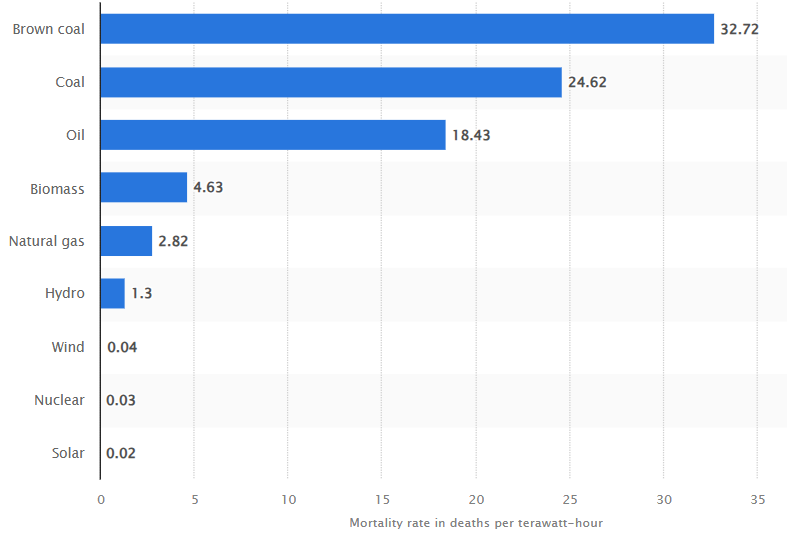
Mortality rate from accidents and air pollution per unit of electricity worldwide, by energy source. (statista)
Heavy, unstable atoms undergoing radioactive decay emit three types of ionizing radiation: alpha particles (helium nuclei), which cannot penetrate the skin and can be stopped by a sheet of paper, but are dangerous in the lung; beta particles (electrons), which can penetrate into the body but can be stopped by a sheet of aluminium foil; and gamma radiation (very high-frequency electromagnetic radiation), which can go right through the body and requires several centimetres of lead or concrete, or a metre or so of water, to stop it.
The radiation absorbed by any material is measured in grays (Gy): 1 Gy = 1 J/kg. The radiation absorbed by humans – known as the effective dose – is usually expressed in sieverts (Sv) or millisieverts (mSv); it is calculated by multiplying the absorbed dose (in grays) by a factor that depends on the type of radiation and the type of tissue absorbing the radiation. One gray of alpha radiation, for example, will have a greater effect than one gray of beta radiation on a particular type of tissue, but one sievert of both produces the same biological effect. (In the US: 1 rad = 0.01 Gy; 1 rem = 0.01 Sv, or 10 mSv.)
The following table shows the symptoms corresponding to different doses of ionizing radiation received within one day (nih.gov).
Dose |
Symptoms |
Outcome |
0 - 0.25 Sv |
None |
– |
0.25 - 1 Sv |
Some people feel nausea and loss of appetite |
Bone marrow, lymph nodes and spleen damaged |
1 - 3 Sv |
Mild to severe nausea, loss of appetite, infection |
Same as above, but more severe; recovery probable, but not assured |
3 - 6 Sv |
Severe nausea, loss of appetite; haemorrhaging, infection, diarrhoea, peeling of skin, sterility |
Death if untreated |
6 - 10 Sv |
Above symptoms plus central nervous system impairment |
Death expected |
Above 10 Sv |
Incapacitation |
Death |
The natural background radiation exposure from sun, rocks and building materials in the United States is 3.6 mSv per year on average. The following table gives the typical dose for various additional exposures (nih.gov; new.ans).
Dose |
Activity |
2.4 mSv/yr |
Working in the nuclear industry |
0.01 mSv/yr |
Exposure to public from the nuclear industry |
1.5 mSv/yr |
Airline crew flying 1200 miles a week |
9 mSv/yr |
Airline crew flying from New York to Tokyo (1 trip per week) |
0.10 mSv |
Chest X-ray |
7.0 mSv |
Chest CT scan |
0.015 mSv/yr |
Exposure to public from accident at Three Mile Island |
0.015 mSv/yr |
Exposure to TV viewers watching an average of 10 hours per week |
Large, acute doses of radiation are harmful. But there is a widespread myth that any radiation exposure, however small, carries a health risk. This is known as the linear no-threshold (LNT) model. It implies that if a certain level of radiation exposure produces one cancer in a population of 100 people, then one-tenth of that amount of radiation will produce one cancer in a population of 1000. This is like saying that if 25 cups of water forced down the throat will generally cause a person to die of drowning, then drinking 1 cup of water would produce a 1 in 25 chance of drowning. This flawed model is behind claims that nearly a million people have already died as a result of the Chernobyl disaster (wikipedia). It assumes that every particle or quantum of ionizing radiation is likely to damage a cell’s DNA, producing mutations which lead to cancer. As there are about 1 billion radioactive decays every day in the average adult body, we should all be sick from cancer from a young age if that were true.
There is no scientific evidence that doses below about 50 mSv in a short time or about 100 mSv per year carry any risk; in fact there is abundant evidence that doses up to 100 mSv per year can have beneficial effects. This is known as radiation hormesis (Hecht, 2009; Kauffman, 2003, 2006; world-nuclear). Low levels of exposure can stimulate the body’s defence and repair mechanisms, whereas very high levels overwhelm them.
The main source of exposure for most people is naturally-occurring background radiation. Levels typically range from about 1.5 to 3.5 mSv/year but can be more than 50 mSv/year. Lifetime doses range up to several thousand millisieverts, but there is no evidence of increased cancers or other health problems arising from these high natural levels. Studies have shown that medical and industrial workers who are exposed to radiation above background levels often have lower rates of mortality from cancer and other causes than the general public.
The main contributor to background radiation exposure is usually radon gas from radioactive sources deep underground. Many healing springs and baths derive their benefits from low-dose radiation in the water, usually in the form of absorbed radon gas. In Europe, the use of hot springs with high radon content dates back some 6000 years (radonmine).
It is worth noting that radiation protection standards are based on the discredited linear no-threshold model.
Interestingly, due to the substantial amounts of granite in their construction, many public buildings including Australia’s Parliament House and New York Grand Central Station, would have some difficulty in getting a licence to operate if they were nuclear power stations. (world-nuclear)
Nuclear propulsion is used in ships (mainly aircraft carriers) and military submarines. Russia is the only country with nuclear-powered civilian ships, mainly icebreakers. There are also nuclear-powered missiles, torpedoes and rockets.
Pressurized water reactors are the most common reactors used in ships and submarines. The primary coolant is shown in orange and the secondary coolant (steam and feedwater) in blue. (wikipedia)
Some space probes are powered by radioisotope thermoelectric generators. NASA has a Space Nuclear Propulsion programme. The Russian space agency Roscosmos is developing a nuclear-powered space tug (transport and energy module), with the first flight scheduled for 2030. China is also working on a nuclear-powered spacecraft.

Space tug.
Nuclear fusion is a process whereby two light atomic nuclei combine to form a single heavier one while releasing massive amounts of energy. If one gram of deuterium-tritium fuel undergoes nuclear fusion, it produces 90,000 kilowatt-hours of energy, or the equivalent of 11 tonnes of coal. Nuclear fusion creates little highly radioactive waste, and fusion reactors cannot undergo catastrophic meltdown.
Although tens of billions of dollars have been thrown at (hot) nuclear fusion, there are no prospects of it becoming a viable source of power generation anytime soon, mainly due to the enormous temperatures (up to 300 million degrees Celsius) and pressures required. Tokamak reactors are considered the most likely means of achieving practical nuclear fusion energy. Their basic design is a torus (or donut) within which intense magnetic fields confine very hot plasma. But after 80 years of research, no controlled release of energy from thermonuclear fusion has happened. In the 1970s fusion power was said to be 30 years away. Half a century later, it is still said to be at least 30 years away.

Inside the Joint European Torus tokamak at Culham, UK, with a superimposed hot plasma (euro-fusion). JET failed to generate more power than it consumed. It was shut down in 2023 and decommissioning will last until 2040.
The International Thermonuclear Experimental Reactor (ITER) project was launched in 2007, and involves China, the European Union, India, Japan, Russia, South Korea and the United States. A nuclear fusion complex is being built in southern France. The main reactor is scheduled for completion in 2033-34 and will be the largest fusion reactor ever built. It will fuse deuterium and tritium into helium. The intention is only to demonstrate feasibility, not to generate electricity. The cost was initially budgeted at €6 billion, but later estimates have increased this to €18-22 billion or even €45-65 billion.
The ITER organization has a long history of publishing false and misleading information. For example, a 2024 press release stated that the fusion plant will produce about 500 megawatts (MW) of thermal power, and that if operated continuously and connected to the electric grid, that would translate to about 200 MW of electric power, enough for about 200,000 homes. The press release forgot to mention that running the reactor will consume 440 MW of electrical power, resulting in an overall loss of 220 MW (newenergytimes)!
Since the mid-19th century various scientists and inventors have designed energy-producing devices that challenge the mainstream scientific understanding of the physical world (Tutt, 2001; Manning & Garbon, 2009; Manning & Manewich, 2019). Some of the devices seem to be extracting energy from an as yet unrecognized source – the all-pervasive ether. In principle, the ether could provide an unlimited source of clean energy – an idea that repels some people, who automatically associate abundance with irresponsible consumerism and plundering of the earth’s resources.
At present no proven ‘free-energy’ or ‘over-unity’ devices are available on the market. Jeane Manning and Joel Garbon write:
While capital pours into the conventional technologies, visionary scientists and inventors researching breakthrough energy technologies are languishing due to lack of funding, ignorance and indifference at political level, and often official obstruction and even heavy-handed oppression. (2009, 36)
Engineer John Cliss, a board member of the New Energy Movement, spent several years travelling the world, testing and assessing dozens of new-energy technologies which, according to their inventors, produced more energy than they consumed. He found that many of these claims were false, but that some were true. He points out, however, that he was not allowed to take apart the devices to see exactly what they contain (Manning & Manewich, 2019, chs. 4, 5).
Several potential technologies for future energy generation are outlined below.
‘Cold fusion’ was born in March 1989 when Martin Fleischmann and Stanley Pons reported that experiments with electrochemical cells filled with heavy water (deuterium), using a palladium cathode, had generated so much excess heat that it could not have been produced by a chemical reaction but only by nuclear reactions, including the fusion of two deuterium nuclei (deuterons). Since the experiments took place at room temperature and pressure, this contradicted the mainstream view that the only form of fusion possible is thermonuclear fusion, or ‘hot fusion’, which requires extreme temperatures and pressures to overcome the Coulomb barrier and force two positively-charged nuclei to merge. As a result, ‘cold fusion’ was dismissed as ‘voodoo science’ by many orthodox scientists, especially since several of the attempts to replicate Fleischmann and Pons’ results were unsuccessful (Krivit, 2016b).
Nevertheless, small-scale research has continued to this day in the United States, Russia, China, India, Japan (e.g. here), Italy, France and other countries, and various anomalous phenomena have repeatedly been verified, though some experimental results are very unpredictable (Storms, 2014; Krivit, 2016a; Freire & de Andrade, 2021). This field of research is now usually referred to as low-energy nuclear reactions (LENR) or condensed matter nuclear science (CMNS), rather than ‘cold fusion’, since several types of nuclear reactions occur, and some scientists believe that fusion in the strict sense does not occur at all. According to textbook physics, no nuclear reactions of any kind should be possible at room temperature. Over the years, hundreds of theories have been proposed to explain LENR.
Key results of LENR experiments include anomalous amounts of heat, helium, small amounts of occasional tritium and neutrons, and transmutation of one element (or isotope) into another. These findings have been replicated at over 180 laboratories worldwide in thousands of experimental runs. The various reactions are thought to occur on or near the surface of certain special materials containing hydrogen isotopes, but only in certain locations where the conditions are just right. And they take place without the application of high energy and without the release of the harmful, high-intensity radiation normally associated with a nuclear process. There are many different experimental setups but they usually include: a metal, such as palladium or nickel, in bulk, thin films or powder; deuterium and/or hydrogen, in the form of water, gas or plasma; and an excitation in the form of electricity, magnetism, temperature, pressure, laser beams or acoustic waves.
This research field actually originated in the 1910s and 1920s, when some scientists – two of them Nobel laureates – published reports in top scientific journals of experiments using simple, low-energy benchtop apparatus that resulted in elemental transmutations (the production of noble gases or precious metals) without the use of radioactive sources. The experiments were difficult to replicate and since the results defied prevailing theory they were largely forgotten (Krivit, 2016c).
That modern science’s understanding of nuclear reactions is inadequate is also shown by the evidence for transmutation in living organisms (Storms, 2010, 19). Starting with the work of Louis Kervran in the 1960s, various researchers have established that organisms can create elements they need by transmuting available elements. Moulds and yeasts, for example, are able to increase the concentrations of potassium, magnesium, iron and calcium in their cells. The abundance of elements on earth has probably been modified by the presence of life, and it may be possible to use bacteria to decontaminate soil. Nature apparently has gentler ways of achieving transmutation and other nuclear reactions than the violent methods with which mainstream science is obsessed.
Nuclear fission and (hot) fusion involve ‘strong nuclear interactions’, which release energetic electrons and alpha particles, and high-energy neutrons, gamma rays and X-rays. That is why radiation containment structures for commercial fission reactors often have walls consisting of 1 metre thick reinforced concrete and 25 cm thick special steel plates. According to a theory developed by Lewis Larsen and Allan Widom, LENR does not involve nuclear fusion but rather weak-interaction neutron creation and ultra-low-momentum, neutron-catalyzed, low-energy nuclear reactions (Krivit, 2010; Srivastava et al., 2010).
‘Weak interactions’ are defined as any type of nuclear process that emits or absorbs a neutrino (a hypothetical, electrically neutral particle with such a tiny mass that it barely interacts with other matter); an example is beta decay, whereby a neutron in an unstable atom emits an electron and a neutrino and turns into a proton. According to the Widom-Larsen theory, the reason why LENR cells do not emit large fluxes of high-energy neutrons is because nearly all ultra-low-momentum neutrons are absorbed locally. And the reason researchers have seen little or no gamma emissions from LENR experiments – of the kind associated with fission and fusion – is because gamma radiation is internally converted into more-benign, infrared (heat) radiation.
Larsen and Widom see their theory as an extension of the mainstream ‘standard model’ of particle physics, and that’s why they managed to silence some long-standing critics of ‘cold fusion’. However, the standard model has many illogical and irrational features; a realistic model requires an underlying, subquantum energy continuum – the ether (see The farce of modern physics).
Critics of the Widom-Larsen theory argue that it involves ad hoc assumptions, dressed up in complex mathematics, and cannot explain all the observed phenomena. They propose, for example, that protons or deuterons, rather than neutrons, play a key role in transmutation (Storms, 2010). To overcome or penetrate the Coulomb barrier, hot fusion uses high energy, i.e. brute force, whereas in cold fusion, according to Edmund Storms (2014), the barrier can be lowered by a buildup of electric charge, which accompanies the formation of a metallic form of hydrogen (hydroton) in nanocracks in the surface of the metal being used, with energy being dissipated through the emission of low-energy photons (coldfusionnow).
LENR scientists argue that, if successfully commercialized, low-energy nuclear reactions could herald a new era of affordable, safe and clean energy.
Being nuclear, LENRs could potentially improve by many orders of magnitude the density and longevity of energy storage compared with existing technologies such as chemical batteries and electrostatic capacitors, and provide a vast array of cost effective, scalable, portable, and distributed power generation systems that could be deployed throughout the world. ... LENRs can be used to develop a safe nuclear energy technology that does not create dangerous hard radiation and/or long-lived radioactive and toxic wastes. (Larsen, 2008)
LENR might also solve many serious public safety and environmental problems associated with current nuclear fission technologies.
[R]adioactive nuclear waste in spent reactor fuel rods and assemblies could potentially be processed onsite with LENR technology to transmute waste into complex arrays of non-radioactive stable elements and isotopes. Exactly the same approach could be used to get rid of fuel remaining in nuclear reactors after permanent shutdown. (Larsen, 2009)
Italian inventor Andrea Rossi, with the help of Sergio Focardi, has developed a nickel-hydrogen reactor, known as the Energy Catalyzer or E-Cat (ecat; e-catworld). The device is said to work by infusing heated hydrogen into nickel with the aid of an unnamed catalyst, resulting in the transmutation of nickel into copper and the release of heat. The E-Cat has aroused great controversy both inside and outside the LENR community, with many regarding it as a scam (newenergytimes). Exactly what is happening in the device remains unclear as Rossi is keeping many technical details secret; several critical questions have been raised about his claim that a proton is added to the nickel nucleus (wikipedia). Nevertheless, his demonstrations have impressed some scientists and attracted millions of dollars in funding.
In 2016 Rossi’s Leonardo Corporation announced that a year-long test of a 1 MW E-Cat plant had shown that it produced over six times the amount of energy it consumed, and often over 50 times more. Due to problems with the large plant, Rossi then focused on the development of a smaller, domestic heater, known as the E-Cat SK, for which many impressive claims were made but which did not turn into a commercial product. As of 2025, Rossi was inviting preorders for E-Cat NGU generators, ranging from 100 W ($249) to a 1 MW plant ($2.5 million).
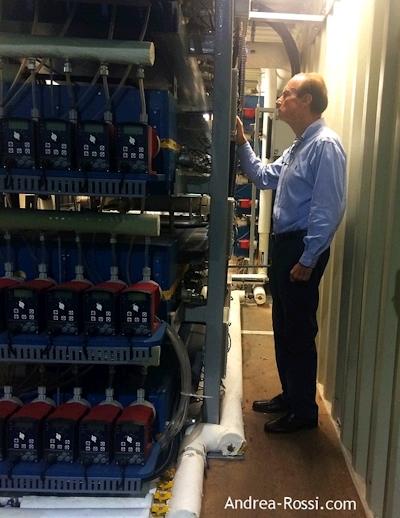
Andrea Rossi inspects his 1 MW E-Cat plant, 2014.
Brillouin Energy is a leading US company in the field of LENR. In 2018 it obtained a patent for the ‘controlled electron capture reaction’, a key component of its ‘hydrogen hot tube’ reactor system, which uses a nickel catalyst. Stanford Research Institute International has verified that the reactor produces excess heat. Brillouin argues that 30,000 homes could be powered for one year on the amount of hydrogen in an average glass of water.
Researchers worldwide are working on many other devices. For example, Tadahiko Mizuno and Jed Rothwell (2019) have developed a small reactor that is said to produce excess heat by heating a nickel mesh coated with a thin film of palladium. They claim that their experiment has the best reproducibility and control, and the highest power output of any ‘cold fusion’ experiment on record. With 50 W of input, it produces ~250 W of excess heat, and with 300 W it produces ~2 to 3 kW.

Mizuno & Rothwell’s R20 reactor used as a room heater. It is powered
by a 500 W, 100 V laboratory power supply (not shown in this photo).
Brilliant Light Power Inc., formerly BlackLight Power Inc., a company founded by Randell Mills in 1991, claims to have discovered a new, sustainable, nonpolluting energy source. The patented BlackLight process is said to involve the formation of a previously unknown form of hydrogen called ‘hydrino’. Hydrinos are produced when the electron in a hydrogen atom transitions to an energy state below its ‘ground state’, resulting in a smaller-radius hydrogen atom – something which is impossible according to orthodox science. This is accompanied by the release of large amounts of chemical energy, which can generate power as either electricity or heat. The only consumable, the hydrogen fuel, is obtainable from water. Mill’s theory is widely regarded as pseudoscience (wikipedia).
Mills has received over $75 million in funding from private investors, and $1.1 million in government funding. His team has developed a series of prototypes, but so far all announcements of upcoming commercial products have come to nothing. The most promising design at present is the SunCell, which uses a catalyst to convert hydrogen directly into hydrinos, releasing brilliant high-energy light that can be converted into electricity using concentrator photovoltaic cells. The electrical generation cost is expected to be less than 10% of that of any known power source (brilliantlightpower). Whether this is a realistic assessment or just hype remains to be seen.
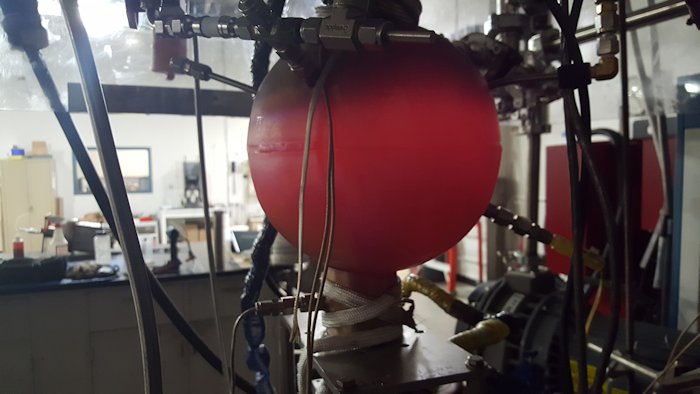
The SunCell.
Canadian scientists and inventors Paulo and Alexandra Correa have developed a detailed model of a dynamic ether, known as aetherometry. Their experiments with electroscopes, ‘orgone accumulators’ (a box consisting of alternating layers of metallic and organic materials), and Tesla coils point to the existence of both electric and nonelectric forms of etheric energy. They rule out a purely electromagnetic ether, such as the zero-point field of quantum physics. They contend that ether units ‘superimpose’ to form physical particles, which take the shape of a torus. Pursuing an insight of Wilhelm Reich, they have found evidence that photons do not travel through space: the sun emits electric, etheric radiation which can travel much faster than light, and photons are transient, vortex-like structures generated from the energy shed by decelerating physical charges (such as electrons). They argue that gravity is essentially an electrodynamic force, and have found experimental evidence of antigravity (Aetherometry and gravity). Aetherometry proposes that the rotational and translatory movements of planets, stars and galaxies are the result of spinning, vortical motions of ether on multiple scales.
The Correas have developed several power-generation technologies:
• the patented Pulsed Abnormal Glow Discharge (PAGD) plasma reactor, which
produces excess energy by setting up a resonance between accelerated electron
plasma and local etheric energy;
• the HYBORAC energy converter, which taps the latent heat of a Faraday cage
and can supply heat, mechanical work and electricity around the clock using
solar, atmospheric and geologic sources of etheric energy;
• the patented self-sustaining aether motor, which extracts etheric energy
from Faraday cage-like enclosures or resonant cavities, living beings, the
ground, vacuums and atmospheric antennas.

Paulo and Alexandra Correa holding PAGD reactors in their laboratory.
The Correas say that their PAGD technology has been ready for commercialization for a couple of decades. Yet despite intense efforts, ‘no sponsor has come forth to help this technology come to fruition. Ecologist movements have been silent on the technology. Politicians, governments and their granting agencies have refused to become involved unless total control is given to them.’
The Correas observe that few alleged excess-energy devices have survived detailed scientific and technical scrutiny. They describe the LENR field as ‘a waste dump’, where ‘genuine facts were lumped with factual errors and imaginary facts’, and note that it has ‘failed, after nearly a half-century, to produce a single working prototype of an actual power generator’. Based on their own experimental research, they have proposed a pathway for the ‘cold’ fusion of deuterium into helium-4 which can release anomalous heat without producing any neutrons or gamma radiation. Their discoveries of gravitationally confined and electrodynamically driven hydrogen fusion pathways cast doubt on the feasibility of achieving controlled hot fusion by the conventional method of injecting greater and greater thermal power into magnetically and inertially confined hydrogen plasmas (Correa & Correa, 2025, 2004). Without an understanding of ether physics, researchers are simply groping in the dark.
John Abbot & Jennifer Marohasy (eds.), Climate Change: The facts 2025, Melbourne: Institute of Public Affairs, 2024
Larry Bell, Renewable energy delusions: getting a real grip on alternatives, 15 March 2011, blogs.forbes.com
Christopher Booker, Why the £250bn wind power industry could be the greatest scam of our age, 28 February 2011, dailymail.co.uk
Robert Bryce, Power Hungry: The myths of ‘green’ energy and the real fuels of the future, Philadelphia, PA: PublicAffairs, 2008
Caithness Windfarm Information Forum, Summary of wind turbine accident data to 31 December 2011, 2011
Dong Choi, ‘Oceanic crust is continental; great, timely news for the oil industry!’ (Editorial), New Concepts in Global Tectonics Newsletter, no. 45, 2007, p. 2
Cutler J. Cleveland, ‘Energy transitions past and future’, The Encyclopedia of Earth, 2012
Paulo N. Correa & Alexandra N. Correa, The ‘Correa solution’ to the ‘cold-fusion’ enigma: the 2004 DoE Report on the submitted Cold Fusion Review, and the generation of anomalous heat in table-top fusion reactors, 2004, aetherometry.com
Paulo N. Correa & Alexandra N. Correa, ‘Critical appraisal of XXIst century energy science and technology (3): Nuclear fusion, LENR and anomalous plasma electrodynamics’, Journal of Aetherometric Research, v. 4, no. 5, 2025
L.O. Freire & D.A. de Andrade, ‘Preliminary survey on cold fusion: It’s not pathological science and may require revision of nuclear theory’, Journal of Electroanalytical Chemistry, v. 903, 2021, 115871
Søren Hansen, The Danish energy transition, Global Warming Policy Foundation, 2024
William Happer, The truth about greenhouse gases: the dubious science of the climate crusaders, 2011
Laurence Hecht, ‘Is the fear of radiation constitutional?’, 21st Century Science & Technology, 2009, pp. 12-28
Craig D. Idso & Sherwood B. Idso, Carbon Dioxide and Earth’s Future: Pursuing the prudent path, 2011, co2science.org
Joel M. Kauffman, ‘Radiation hormesis: demonstrated, deconstructed, denied, dismissed, and some implications for public policy’, Journal of Scientific Exploration, v. 17, 2003, pp. 389-407
Joel M. Kauffman, Malignant Medical Myths: Why medical treatment causes 200,000 deaths in the USA each year, and how to protect yourself, West Conshohocken, PA: Infinity, 2006
J. Kill, S. Ozinga, S. Pavett & R. Wainwright, Trading Carbon: How it works and why it is controversial, FERN, 2010
Steve Krivit, Cold fusion is neither, 2010, newenergytimes.com
Steven Krivit, Hacking the Atom (Explorations in Nuclear Research, Book 1), San Rafael, CA: Pacific Oaks Press, 2016a (Kindle ed.)
Steven Krivit, Fusion Fiasco (Explorations in Nuclear Research, Book 2), San Rafael, CA: Pacific Oaks Press, 2016b (Kindle ed.)
Steven Krivit, Lost History (Explorations in Nuclear Research, Book 3), San Rafael, CA: Pacific Oaks Press, 2016c (Kindle ed.)
Lewis Larsen, Low energy nuclear reactions for green energy, 2008
Lewis Larsen, Safe, less costly nuclear reactor decommissioning and more, 2009
David J.C. MacKay, Sustainable Energy – Without the Hot Air, Cambridge: UIT, 2009
Jeane Manning & Joel Garbon, Breakthrough Power: How quantum-leap new energy inventions can transform our world, Vancouver: Amber Bridge Books, 2009
Jeane Manning & Susan Manewich, Hidden Energy: Tesla-inspired inventors and a mindful path to energy abundance, FriesenPress, 2019 (Kindle ed.)
Mark P. Mills, The ‘Energy Transition’ Delusion: A reality reset, Manhattan Institute, 2022
Tadahiko Mizuno & Jed Rothwell, Increased excess heat from palladium deposited on nickel, 2019
Andrew Montford, A Cost-Benefit Analysis of Net Zero, Net Zero Watch, 2024
Vaclav Smil, Energy in Nature and Society: General energetics of complex systems, Cambridge, MA: MIT Press, 2008a
Vaclav Smil, ‘Moore’s curse and the great energy delusion’, The American, November 2008b
Vaclav Smil, ‘Science, energy, ethics, and civilization’, in: R.Y. Chiao et al. (eds.), Visions of Discovery: New light on physics, cosmology, and consciousness, Cambridge: Cambridge University Press, 2010a, pp. 709-29
Vaclav Smil, Power density primer: understanding the spatial dimension of the unfolding transition to renewable electricity generation, 2010b
Vaclav Smil, ‘It’s a material world’, Mechanical Engineering, v. 146, no. 1, 2023, pp. 30-35
Vaclav Smil, Halfway between Kyoto and 2050: zero carbon is a highly unlikely outcome, Fraser Institute, 2024
Y.N. Srivastava, A. Widom & L. Larsen, ‘A primer for electroweak induced low-energy nuclear reactions’, Pramana, v. 75, no. 4, 2010, pp. 617-37
Edmund Storms, ‘Status of cold fusion (2010)’, Naturwissenschaften, v. 97, 2010, pp. 861-81, ncbi.nlm.nih.gov, preprint: lenr-canr.org
Edmund Storms, The Explanation of Low Energy Nuclear Reaction: An examination of the relationship between observation and explanation, Concord, NH: Infinite Energy Press, 2014 (Kindle ed.)
Stuart Young Consulting, Analysis of UK Wind Power Generation: November 2008 to December 2010, John Muir Trust, 2011
Keith Tutt, The Search for Free Energy: A scientific tale of jealousy, genius and electricity, London: Simon & Schuster, 2001
B.I. Vasiliev & T. Yano, ‘Ancient and continental rocks discovered in the ocean floors’, New Concepts in Global Tectonics Newsletter, no. 43, 2007, pp. 3-17
S.E. Weishaar (ed.), Research Handbook on Emissions Trading, Northampton, MA: Edward Elgar Publishing, 2016
Climate models and climate catastrophe
Poleshifts: theosophy and science contrasted