
There is a lot of talk nowadays about ‘combating climate change’ – an absurd expression which makes it sound like humans can stop the climate from changing. To achieve this we would need to control the sun’s cycles, the earth’s orbital cycles, geological activity, ocean cycles and currents, the water cycle, atmospheric composition and circulation, biosphere evolution, and the galactic cosmic ray flux, along with the complex interactions between all these different factors. The fact that ‘climate change’ has come to be virtually synonymous with ‘man-made climate change’ in many people’s minds shows the level of ignorance and delusion.
The mainstream view, as articulated by the UN’s Intergovernmental Panel on Climate Change (IPCC), is that most of the warming since 1850 and all the warming since 1950 are the result of anthropogenic greenhouse gas emissions, and that unless drastic measures are taken to slash emissions and switch to alternative energy sources, the result will be dangerous, runaway warming. There may well be good reasons to gradually reduce our dependence on carbon-based fuels, but the claim that this is necessary to save the world from catastrophic global warming is based on shoddy science and alarmist hype.
The modern warming trend began about 350 years ago in the middle of the Little Ice Age (1300-1845), and has proceeded in fits and starts. Not even the IPCC claims that modern warming was initiated by an increase in greenhouse gases; anthropogenic emissions only began to rise rapidly in the 1950s. During the Little Ice Age mountain glaciers advanced and swallowed entire towns, and there were severe droughts, crop failures, famines and plagues. A third of the population of Europe and Asia died during the extremely cold mid-17th century (Crok & May, 2023, ch. 3). The warming since then has mainly been in nighttime, winter temperatures in the northern hemisphere, and has been net-beneficial.
The Little Ice Age was preceded by the Medieval Warm Period (c. 950-1300), when some regions of the earth were warmer than today. The Vikings then grew crops in Greenland where it is impossible today, and buried people in land that is now permafrost. Much of the earth was also warmer than today in Roman times, when there were vineyards as far north as Hadrian's Wall in England, and in Minoan times (around 1500 BCE).
The IPCC has tried hard to erase these earlier warm and cool periods. Over the years, it has demonstrated that it is not an objective scientific body, but an advocacy group with a political agenda. It lies at the heart of a vast, richly subsidized ‘green blob’ of activists, propagandists, government bureaucrats, ‘green’ billionaires and other grifters.
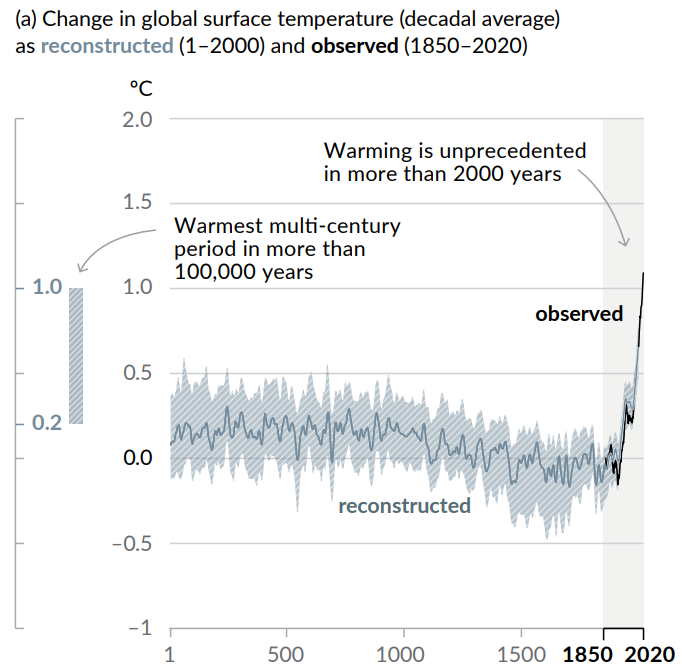
In its 2021 Sixth Assessment Report (AR6) the IPCC includes a new hockey-stick graph of reconstructed global temperatures over the last 2000 years, with instrumentally measured data tacked on the end (SPM). Like the fraudulent hockey stick in its 2001 report, the new one was fabricated by cherry-picking and statistically massaging dubious proxy data (mainly tree rings) and ignoring studies that show larger natural climate variations (climateaudit; Crok & May, ch. 2). It is a blatant attempt to rewrite climate history and fuel climate hysteria.

An alternative reconstruction of extra-tropical (30-90°N) mean decadal temperature variations relative to the 1961-1990 mean, showing the Roman Warm Period (RWP), Dark Ages Cold Period (DACP), Medieval Warm Period (MWP), Little Ice Age (LIA) and Current Warm Period (CWP). (Idso & Idso, 2011)
We are currently living in an interglacial period known as the Holocene, which began 11,700 BP (years before 2000). During the Holocene Climate Optimum (or Holocene Thermal Maximum), 9600-5500 years ago, temperatures were higher than today, as demonstrated by the much higher treelines and less prevalent glaciers at that time. It was followed by a cooling period known as the Neoglacial (5200-400 BP). The IPCC, however, claims that current global surface temperatures are ‘more likely than not unprecedented in the past 125,000 years’ (TS), i.e. since the previous interglacial (the Eemian), though it admits that the uncertainty regarding the mid-Holocene temperature is at least as large as the total modern warming (Crok & May, ch. 1). During the Eemian, Europe was inhabited by warm-climate animals such as water buffalo and elephants, and sea level was 10 metres higher than today.
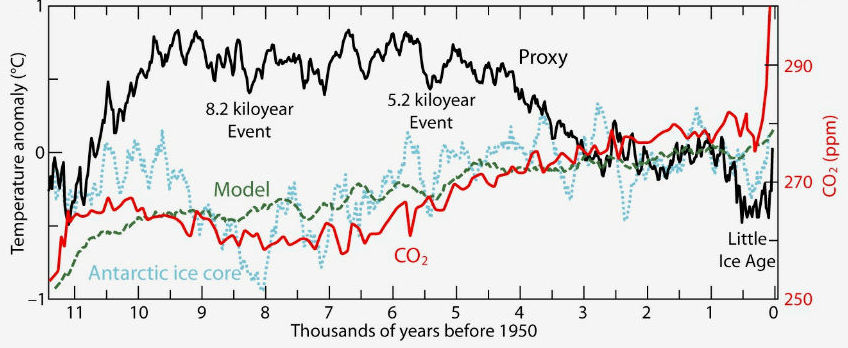
Holocene climate: Black line = global temperature reconstruction (from proxies). Dotted blue line = Antarctic temperature reconstruction (from ice cores). Red line = atmospheric CO2 reconstruction. Dashed green line = model simulation of Holocene temperatures, which fails miserably to match reality, showing that CO2 is not the primary climate control knob (this is officially known as the ‘Holocene temperature conundrum’). The 8.2 and 5.2 kiloyear cooling events coincided with grand minimums in solar activity. (Vinós, 2023, ch. 45)

Greenland GISP ice-core data showing warmings and coolings. (Abbot & Marohasy, 2024, 74)
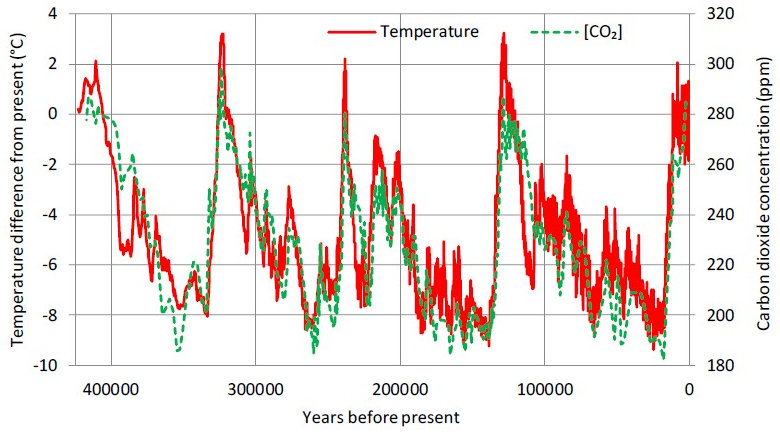
During the preceding Pleistocene epoch (beginning 2.6 million years ago), each of the last four interglacials, going back 425,000 years, was warmer than today (Koutsoyiannis (2024b). Ice-core data show a close match between temperature and CO2 during the last few glacials and interglacials, but temperatures tended to rise or fall between 50 and 1000 years before increases or decreases in atmospheric CO2. Glaciations are generally considered to be caused mainly by changes in the earth’s orbital geometry: axial tilt, axial/apsidal precession, and orbital ellipticity (see Poleshifts, part 4).
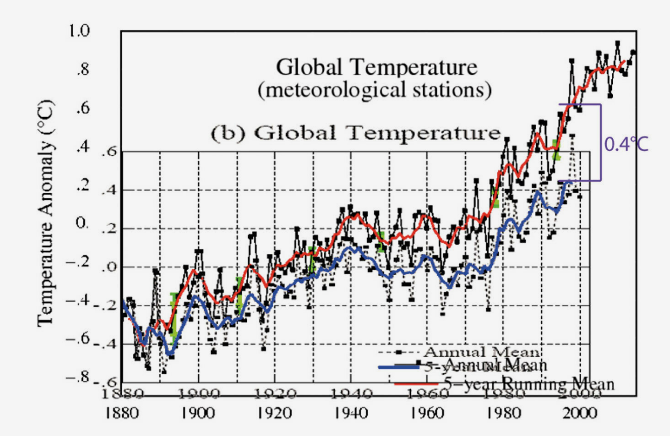
In the 20th century, the average global temperature increased from 1916 to 1945, cooled slightly until 1976 (leading to scaremongering about a new ice age), then rose again until 1997, after which warming slowed considerably until 2015, despite a rapid rise in CO2 levels since 1950. The graph below shows average global temperature anomalies from 1850 to 2024 according to the UK’s HadCRUT5 dataset. ‘Anomaly’ means the extent to which the average annual global temperature differs from the average global temperature during the reference period (1961-1990).

(crudata)
Mainstream climate scientists have a long history of adjusting temperature data in ways that support the official IPCC narrative.

Global warming stalled from 1997 to 2015, as is clearly visible in the HadCRUT3 dataset (blue curve). But the data and methodology were twice adjusted to make ‘the pause’ turn into a warming trend (Vinós, 2023, ch. 34). HadCRUT5 shows 0.2°C more warming than HadCRUT4 over the past 170 years; the cooling from 1850 to 1910 was increased by 37%, while the warming from 2000 to 2020 was increased by 38% (Crok & May, ch. 3).
GISTEMP is a temperature dataset compiled by NASA’s Goddard Institute for Space Studies (GISS). The figure shows an overlay of two GISS global temperature graphs, one from 2001 and the other from 2015. Due to adjustments, in the 2015 version the year 2000 is 0.4°C warmer with respect to 1880 than in the 2001 version. (Crok & May, ch. 1)
A further problem is that land-based temperature measurements can be contaminated by the urban heat island effect. This refers to the fact that increasing urbanization in the vicinity of weather stations leads to higher temperatures. Urban areas can be up to 12°C warmer than nearby rural areas partly due to waste heat from the energy used for heating and cooling, and partly because concrete, brick and asphalt surfaces absorb solar radiation during the daytime and release that heat at night. The IPCC claims that urbanization accounts for less than 10% of the measured land warming, but Soon et al. (2024) found that up to 40% of the warming could be due to urbanization and flawed ‘homogenization’ (i.e. the use of biased urban data to adjust rural data).
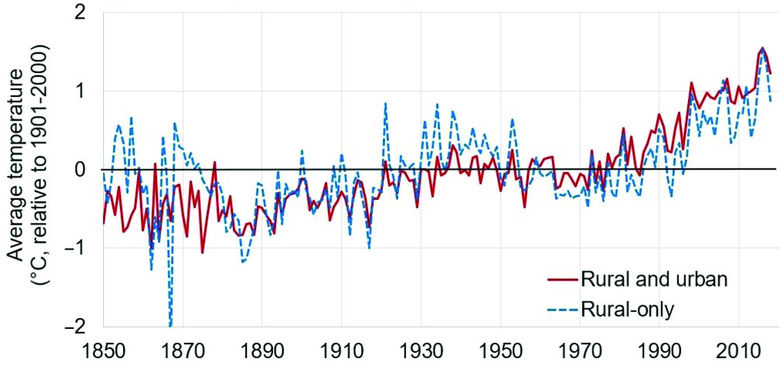
Comparison of ‘rural and urban’ and ‘rural-only’ temperature records. The rural-only record shows a more marked warming trend in the 1930s and 40s and a more marked cooling trend in the 1960s and 70s, contradicting the narrative that rising CO2 levels control temperature. (rclutz)

Satellite data, which are less affected by the urban heat island effect, show a warming trend of 0.15°C per decade since 1979, with the northern hemisphere warming 30% faster than the tropics and 49% faster than the southern hemisphere (drroyspencer). The GISTEMP warming trend since 1979 is 0.19°C per decade (ysbl.york.ac.uk).
As of early 2025, 2024 was officially considered to be the warmest year on record (i.e. since 1850) and 2023 the second warmest. Temperature spikes are not caused by a sudden spike in atmospheric CO2, but are often related to strong El Niños. However, the large temperature spike in 2023-24 seems to have been caused mainly by a massive increase in stratospheric water vapour (the most potent and abundant greenhouse gas) resulting from the 2022 Hunga Tonga submarine volcanic eruption. Since the modern warming trend began about 350 years ago while global temperature measurements mostly go back no further than 1850, it follows that new records will repeatedly be set until the next cooling cycle begins.
The average global temperature today is said to be around 14.5°C, but this is not a very meaningful number since warming trends differ across the globe and some regions may be cooling. Moreover local temperatures can be anywhere between about +55°C and -90°C, while the temperature at any given location commonly varies by 10°C or more in the course of a day and by even more in the course of a year. Even the global average varies by 3.8°C in the course of a year, from around 12° in January to 16° in July, while the northern-hemisphere average varies by 12°C. All the fearmongering about changes of a few tenths of a degree in the global average temperature is absurd.
The IPCC accepts that surface temperatures are not a good indicator of changes in the energy of the climate system. As regards the average temperature of the world ocean (covering about 71% of the earth) from 100 to 2000 metres, the rate of increase is about 0.4°C per century – about half that reported for the earth’s surface over the past century. AR6 (ch. 2) includes a graph showing that from 1871 to 2019 the ocean heat content (0-2000 m depth) increased by 500 zettajoules (1 ZJ = 1021 J). This is a gigantic number, but the report forgets to mention that the ocean currently contains 1,514,000 ZJ, meaning that the increase amounts to only 0.03% of the total energy content (Crok & May, ch. 3).
AR6 claims that the global surface temperature will warm by between 1.3°C and 8.0°C by 2100, depending on the climate model used and the chosen greenhouse-gas emissions scenario or ‘shared socioeconomic pathway’ (SSP). The IPCC admits that the two highest emission scenarios (SSP3-7.0 and SSP5-8.5) are very unlikely, but this admission is deeply buried in the report and unlikely to be seen by policymakers. Moreover, 53% of the references to scenarios in the report are to these two SSPs (Crok & May, 2023, ch. 9). The mainstream media typically publicize the most extreme climate predictions, while keeping quiet about the extremely improbable assumptions underlying them.
Climate models which assume that all the warming in the second half of the 20th century was caused by CO2 are unable to reproduce the rapid warming in the first half of the 20th century or the mid-century cooling, and predict faster warming in the 21st century than has happened. Nor can the models explain the significant melting of the Arctic between 1915 and 1930, or the Arctic cooling from 1976 to 1997, followed by faster-than-expected warming, and they cannot explain why Antarctica hasn’t warmed significantly in 200 years and the tropics have only warmed to a modest degree. Uneven warming cannot be blamed on differing CO2 concentrations in different parts of the world, because CO2 is said to be a globally well-mixed gas.

IPCC dogma allows little role for natural climate change (Vinós, 2023, ch. 8). Current climate dogma is self-perpetuating, since researchers exploring alternative ideas are often denied government funding and access to high-profile journals, and are ignored in IPCC reports.
Dry air is composed of 78% nitrogen, 21% oxygen, 0.9% argon, plus various trace gases, such as carbon dioxide. At the start of 2025 the atmospheric concentration of CO2 stood at 426 parts per million (ppm), i.e. just over four hundredths of one per cent (0.04%) of the earth’s atmosphere. Some scientists claim that according to the ice-core record, this level is higher than it has been for about 3 million years. Analysis of air bubbles trapped in Antarctic ice cores is said to indicate that the atmospheric CO2 concentration ranged from about 180 to 300 ppm during previous interglacials – even though some of them were several degrees warmer than today. What receives far less attention are the uncertainties surrounding the ice-core record.
First, the presence in ice of liquid water alters the original composition of the air in gas inclusions; this can deplete CO2 by 30 to 50%, mostly in the upper layers of the ice sheets. There have also been clear instances of data selection and manipulation by man-made warming proponents (Jaworowski, 2009; Schmitt, 2010). Second, studies of leaf stomata (pores through which plants take in CO2) often show higher and more variable atmospheric CO2 levels than ice cores (Middleton, 2010). They suggest that pre-industrial CO2 levels were commonly in the 360 to 390 ppm range. Third, an analysis of about 100,000 direct measurements of CO2 in the atmosphere made from 1812 to 1961 suggests that atmospheric CO2 levels have varied very widely, with peaks of around 360 ppm in the 1820s and 380 ppm in the 1940s, and are closely correlated with sea surface temperatures; the vast majority of these measurements are rejected by mainstream climatologists (biomind; Berry, 2020, ch. 3).

Average atmospheric CO2 concentrations measured in the 19th and 20th centuries. The values used in ‘consensus’ CO2 reconstructions are circled; the other measurements are rejected. (Jaworowski, 2009)
Anthropogenic CO2 emissions from fossil fuel burning and land-use change are said to put 11 billion tonnes of carbon (GtC) into the atmosphere every year, while the oceans emit 77.6 GtC and the terrestrial biosphere emits 136.7 GtC annually. In other words, human emissions are about 4.7% of total emissions (AR6, ch.5, 5.2.1.5). The oceans contain around 50 times more CO2 than the atmosphere. The annual increase in atmospheric CO2 is 5.1 GtC – all of which is attributed to humans, on the false assumption that the rest of nature is in equilibrium (i.e. the annual amounts of CO2 emitted and absorbed by the oceans and terrestrial biosphere allegedly balance).
The IPCC correctly states that CO2 molecules emitted by nature stay in the atmosphere for around 4 years before being absorbed by the biosphere or oceans. Its assumption that virtually all the atmospheric CO2 increase above 280 ppm is caused by humans requires it to believe that CO2 molecules from human emissions can stay in the atmosphere for thousands of years. This is absurd because all CO2 molecules are identical. Ed Berry (2021) argues that humans are responsible for only 25% of the CO2 increase, while Demetris Koutsoyiannis (2024a) says 17%, and Hermann Harde (2024) less than 10%, with the rest being contributed by the warming-induced expansion of the biosphere.
Short-term changes in atmospheric CO2 lag about 6 to 12 months behind short-term changes in global temperature, while temperature changes show no correlation with short-term changes in anthropogenic CO2 emissions (Humlum et al., 2013; Kalenda, 2024). This is connected with the fact that rising atmospheric temperatures cause the oceans to release more of the CO2 dissolved in them (Henry’s law). Given that temperature changes also tend to precede CO2 changes during recent glacial cycles, it would seem that it is climate that drives CO2, not CO2 that drives climate. Koutsoyiannis (2024b) argues that changes in CO2 lag behind changes in temperature on all timescales, with the time lag being proportional to the timescale.
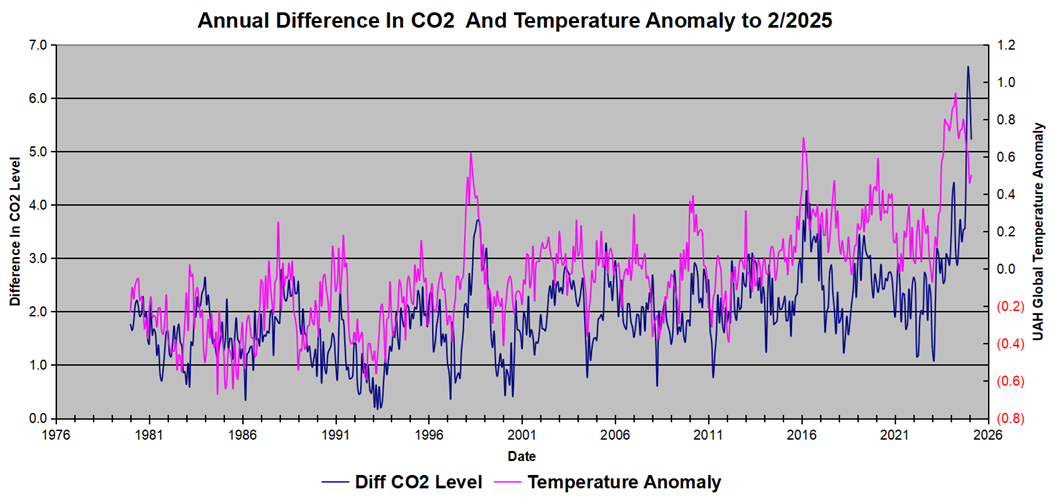
A plot of UAH temperature anomalies (purple) and monthly changes in atmospheric CO2 levels (blue), showing that changes in temperature precede changes in CO2. It can clearly be seen that the 2023-24 temperature spike caused a CO2 spike, rather than being caused by a CO2 spike. (rclutz)
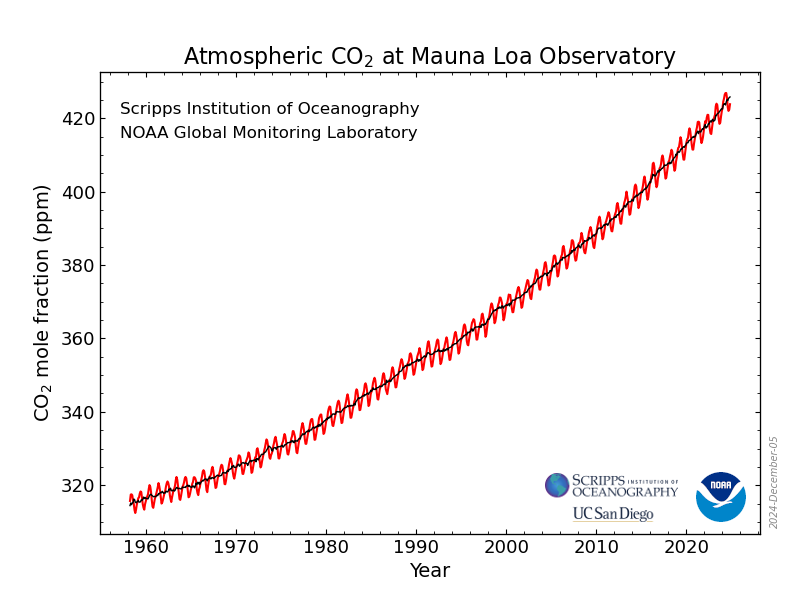
Average annual atmospheric CO2 concentrations measured at Mauna Loa show a steady rise since 1958, even in years when global human emissions temporarily declined (1980-82, 1992, 2009, 2020). In 2020, Covid lockdowns cut emissions by 5.5%, but the Mauna Loa level still rose by 2.56 ppm. (noaa.gov)
Greenhouse gases also include water vapour (responsible for 75% of the greenhouse effect), methane, nitrous oxide, ozone and chlorofluorocarbons. They are often likened to a ‘blanket’ around the earth, because they absorb certain frequencies of infrared (longwave) radiation reflected or emitted from the earth’s surface. They then re-emit this energy, both to space and back to the surface. Absorption of this longwave radiation by the ground reduces net longwave radiation loss from the surface, thereby raising surface temperatures. The general scientific opinion is that a doubling of atmospheric CO2 will produce 1.2ºC of warming.
In a complex system like the climate, there are all sorts of feedbacks, which can either amplify warming (positive feedbacks) or mitigate it (negative feedbacks). As temperature increases, more ocean water evaporates into the atmosphere. Climate models treat water vapour as a positive feedback that amplifies CO2-induced warming, leading to a high ‘equilibrium climate sensitivity’ of 1.8 to 5.6ºC, depending on the climate model. The IPCC’s ‘best estimate’ is 3ºC (meaning that temperature will rise 3º each time the atmospheric CO2 concentration doubles), with 60% being due to the alleged water-vapour feedback.
Climate models are particularly poor in their handling of the hydrological cycle (water vapour, clouds, precipitation). Water vapour can condense to form clouds, which are the most important factor affecting how much of the sun’s radiation reaches the earth’s surface. Cloud cover is a highly dynamic factor, whereas climate models treat it as a constant (notrickszone). Some researchers have highlighted the fact that rising temperatures result in more low-level clouds, which have a cooling effect (negative feedback), resulting in a climate sensitivity of around 0.7ºC (Lindzen & Choi, 2011; Abbot & Marohasy, 2024, ch. 12) or less (Spencer, 2009; Glassman, 2009). Analysis of a century of longwave radiation data indicates that the 120 ppm increase in atmospheric CO2 has had no discernible effect on the greenhouse effect, which remains dominated by the quantity of atmospheric water vapour (Koutsoyiannis & Vournas, 2024).
IPCC climate models predict a ‘hotspot’ about 9-13 km up in the troposphere (the lowest atmospheric layer) above the tropics, due to the supposed water-vapour feedback, but the hotspot does not exist. The models for the IPCC’s 2013 Fifth Assessment Report (AR5) showed too much warming over the sea surface and in the tropical troposphere. The AR6 models are even worse: they show too much warming throughout the lower and mid-troposphere, both in the tropics and globally. The observed rate of upper-air warming is 0.17°C per decade, whereas the average model prediction is 4°C per decade, 2.4 times higher (McKitrick & Christy, 2020). The model runs that best correspond to observations in the troposphere are those in which the greenhouse gas effect is omitted altogether (Crok & May, 2023, ch. 8).
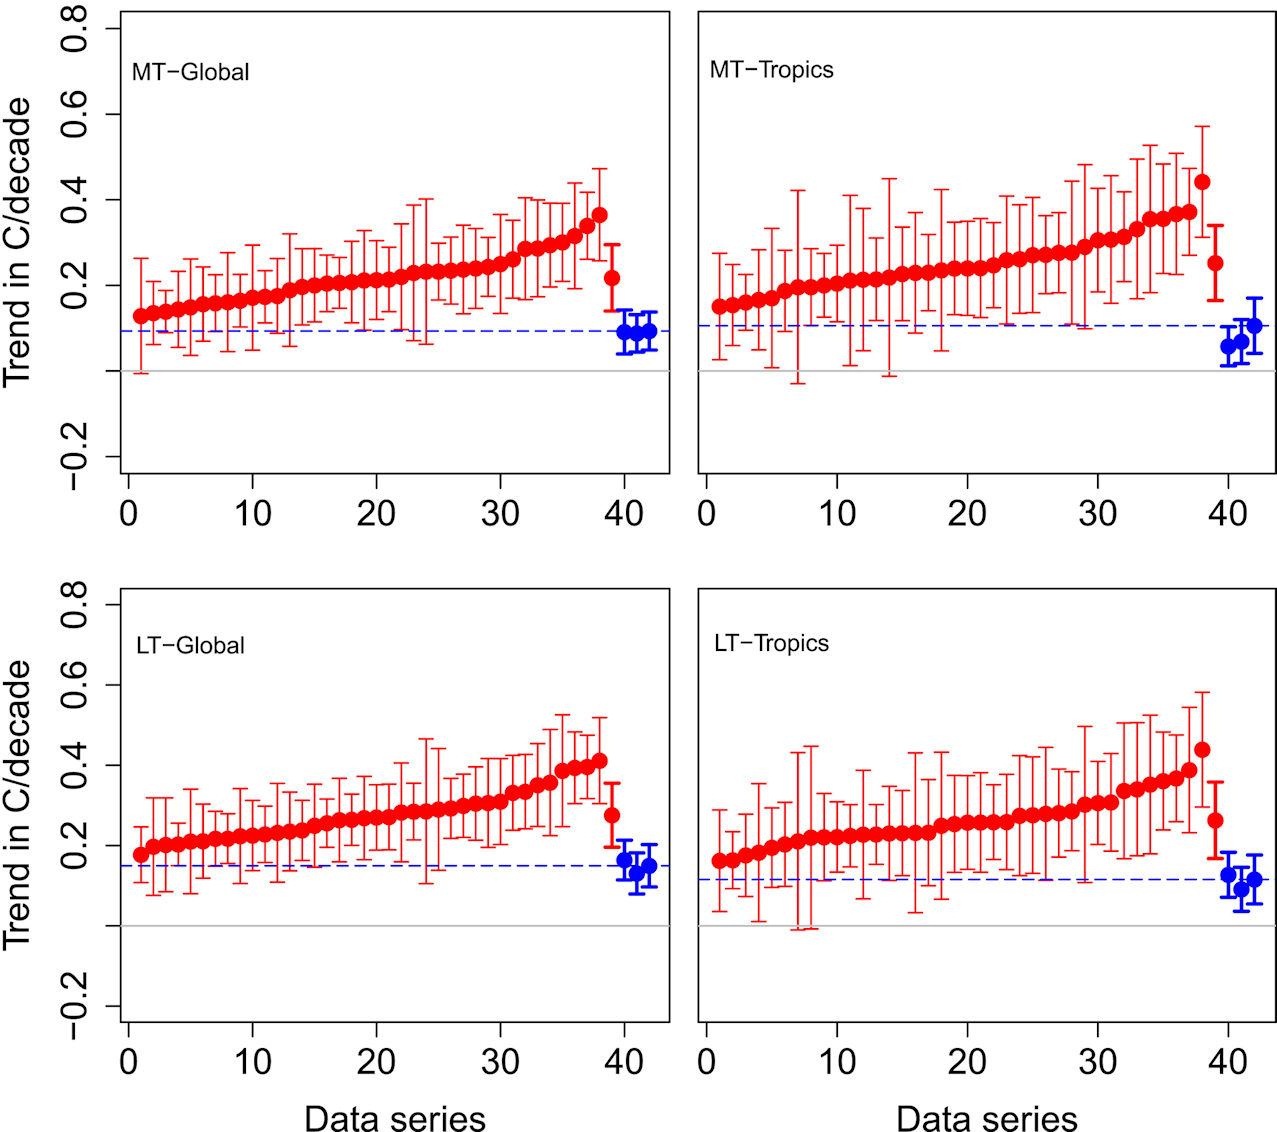
Trends and 95% confidence intervals for 38 AR6 models (red dots and thin bars), model mean (red dot and thick bar), and three observational datasets (blue). The horizontal dashed line shows the mean satellite trend. MT = mid-troposphere; LT = lower troposphere. (McKitrick & Christy, 2020)
The earth has an average albedo of around 0.29, meaning that 29% of the incoming solar energy is reflected back into space, primarily by clouds, ice and snow, while the rest is absorbed by the atmosphere (23%) and by the surface (48%). The albedo changes by only 0.2% from year to year, and appears to be controlled by changes in cloud cover. An albedo of 0.32 would probably lead to glaciation, while an albedo of 0.27 would allow palm trees to grow at the poles. Climate models fail to reproduce the annual albedo cycle, the small variability from year to year, and the symmetry between the albedos of the northern and southern hemispheres (Vinós, 2023, ch. 3).
If current warming were mainly caused by increasing greenhouse gases absorbing more infrared radiation, observations should show a decrease in outgoing infrared radiation, but instead they show an increase. This should cause cooling, unless it is being offset by a greater increase in absorbed solar radiation, most likely due to a decrease in albedo (Vinós, 2023, chs. 6 & 7). A 1% decrease in cloud cover raises global temperatures by 0.1ºC (Abbot & Marohasy, 2024, 143). Even some consensus scientists have attributed 0.2º of very recent warming to a decline in low-altitude clouds (phys).
An analysis by Nicolov & Zeller (2024) concluded that 100% of the global warming trend from 2000 to 2024 and 83% of the interannual variability of the global surface temperature can be explained by the satellite-observed decrease of planetary albedo (‘global brightening’) along with variations in the energy emitted by the sun (total solar irradiance or TSI). Changes in earth’s cloud albedo were the dominant driver, while TSI played only a marginal role.
The sun supplies 99.97% of the energy driving the earth’s climate system. In the course of the 11-year sunspot cycle TSI varies by only 0.1% – too little to have a significant direct impact on the climate, but various amplification mechanisms have been proposed. Moreover, the variation in ultraviolet radiation is 30 times greater and affects stratospheric ozone and atmospheric circulation, which can alter the poleward transport of heat and moisture.
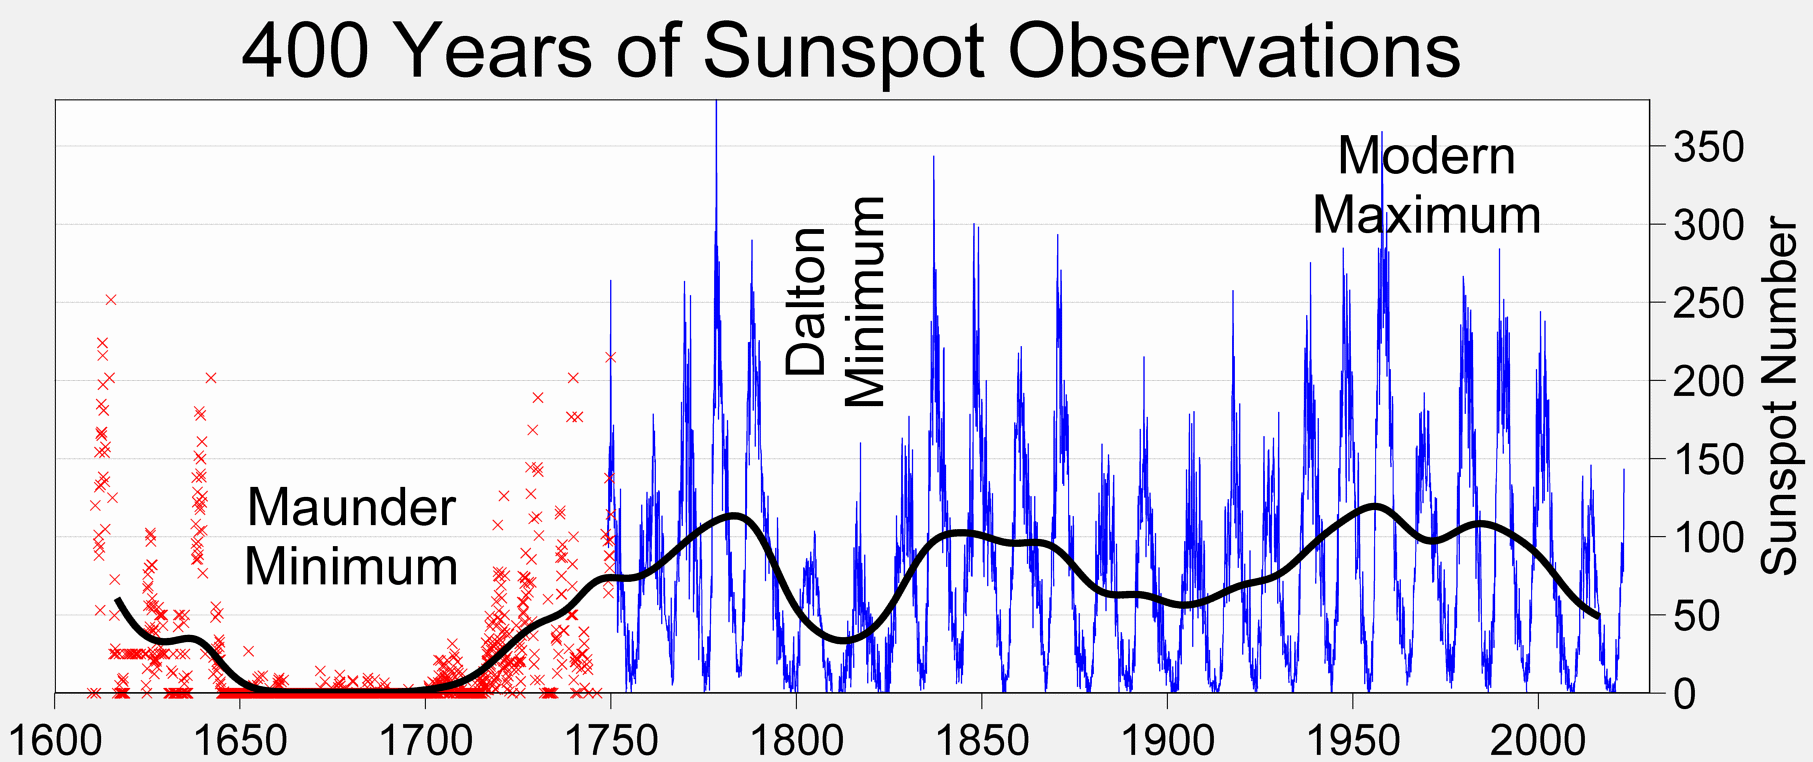
There is a clear correlation between low sunspot numbers and cold periods on earth, such as the Oort Minimum (1040-1080), the Wolf Minimum (1280-1350), the Spörer Minimum (1450-1550), the Maunder Minimum (1645-1715) and the Dalton Minimum (1790-1830); the last four occurred during the Little Ice Age, one of the coldest periods of the Holocene. The preceding Medieval Warm Period coincided with a solar maximum. The sun also undergoes longer cycles of around 90, 105, 200, 1000 and 2400 years, which correlate with various climate events. The precise causal mechanisms are not understood, and the IPCC does not bother to explore them, preferring to deny any major solar impact on climate (Climate models; Crok & May, ch. 6).
According to a theory pioneered by Henrik Svensmark, when solar activity – and the solar magnetic field – weakens, more galactic cosmic rays can penetrate the earth’s atmosphere, resulting in more cloud condensation nuclei, greater cloud cover and lower temperatures. The IPCC ignores this possible indirect influence of the sun on earth’s climate. Experiments confirm that this mechanism could significantly affect the formation of cloud condensation nuclei and either increase or decrease cloud cover in the lower atmosphere (Kirkby, 2007; Svensmark & Shaviv, 2017).
The heat content of the atmosphere is a thousand times smaller than the heat content of the oceans, which contain about 96% of the energy in the climate system. This means that a drop in ocean temperature of 1/1000ºC would raise the air temperature by 1ºC. Over half the solar energy absorbed by the earth is absorbed in the tropics, and there is a good correlation between sea surface temperatures in the tropical Pacific and average global temperature.
There is also evidence that the 18.6-year lunar nodal cycle affects air and surface temperatures in the Pacific (Vinós, 2023, ch. 48). The plane of the moon’s orbit is tilted at 5º to the ecliptic (the plane of the earth’s orbit around the sun). The lunar nodes are the two points where the moon’s orbital path intersects the ecliptic, and rotate (precess) clockwise around the earth in a period of 18.6 years.
The Modern Solar Maximum from 1935 to 2005 was the longest period of above-average solar activity in at least the last 600 years, and contributed to the highest rate of warming in at least 600 years. The latest phase of global warming began in 1976 with a sudden climate shift in the Pacific Ocean that increased zonal (east-west) atmospheric circulation and decreased meridional (north-south) heat transport. At the same time the multidecadal oceanic oscillations changed from a cold phase, which had led to the 1945-1975 cooling period (mitigated by high solar activity), to a warm phase (Vinós, 2023, ch. 34). Another abrupt climate shift occurred in 1997, which increased the transport of heat from lower latitudes to the Arctic, causing both Arctic warming and the pause in midlatitude warming. There have been nearly two dozen sudden climate shifts during the Holocene, but climate models are unable to replicate them.
Lower solar activity since 2008 (solar cycles 24 and 25) has helped to dampen the warming, but did not reverse it. From around 2025 the Atlantic Multidecadal Oscillation (which has a 60-year period) will enter another negative phase, leading to lower North Atlantic sea surface temperatures. This might cool global temperatures by 0.1-0.3°C, making the 2030s slightly cooler than the 2020s (Vinós, 2023, ch. 19). Thereafter solar activity is expected to increase again, producing renewed warming. IPCC models predict that by 2100 the globe will most likely be 1° to 3° warmer than today; a warming of 1° is certainly possible, in which case sea levels will rise by 9 cm.
There are as yet poorly understood interconnections between solar cycles, ocean cycles, changes in heat transport and changes in albedo. The belief that one minor constituent of the atmosphere (CO2) controls nearly all aspects of climate is naïve and delusional. There is little correlation between global temperature and atmospheric CO2 concentration for most of the Phanerozoic (the last 540 million years). At times, CO2 levels have been up to 10 times higher than today, even during the late Ordovician glaciation. The relative stability of the earth’s temperature over millions of years indicates that the climate is dominated by negative, stabilizing feedbacks; the earth is a self-regulating organism, with alternating cycles of warming and cooling.

Reconstructions of global temperature and atmospheric CO2 during the Phanerozoic (Koutsoyiannis, 2024b). A major problem is the very low resolution of the proxy data: a single data point may cover a period of a million years. There are also problems with the radiometric timescale (see The age of earth).
Most of the sun’s radiation is received in the tropics, and heat is then redistributed towards the poles via the atmosphere and oceans, making high latitudes warmer than they would otherwise be. The changing distribution of land and sea and the changing topography of the continents and ocean floor, caused by vertical movements of the earth’s crust, are important factors in this regard, as is the changing inclination of the earth’s axis, which alters the amount of solar energy received in different latitudes (see Sunken continents; Poleshifts, part 4).
The temperature difference between the equator and the poles has changed significantly over geologic time. In the Eocene it was only about 20°, today it is about 40°C, and during glacial maximums it is about 60°C (Lindzen, 2022). The average temperature at the equator has only varied between around 24° and 35°, whereas the average temperature at the poles has ranged from about -55° to +13°. At present the average global temperature is only 14.5°, and there are continental ice sheets in both Greenland and Antarctica. That is why the earth’s current climate is classified as an ‘icehouse’; it is among the coldest 10% of climates during the Phanerozoic (Scotese et al., 2021).
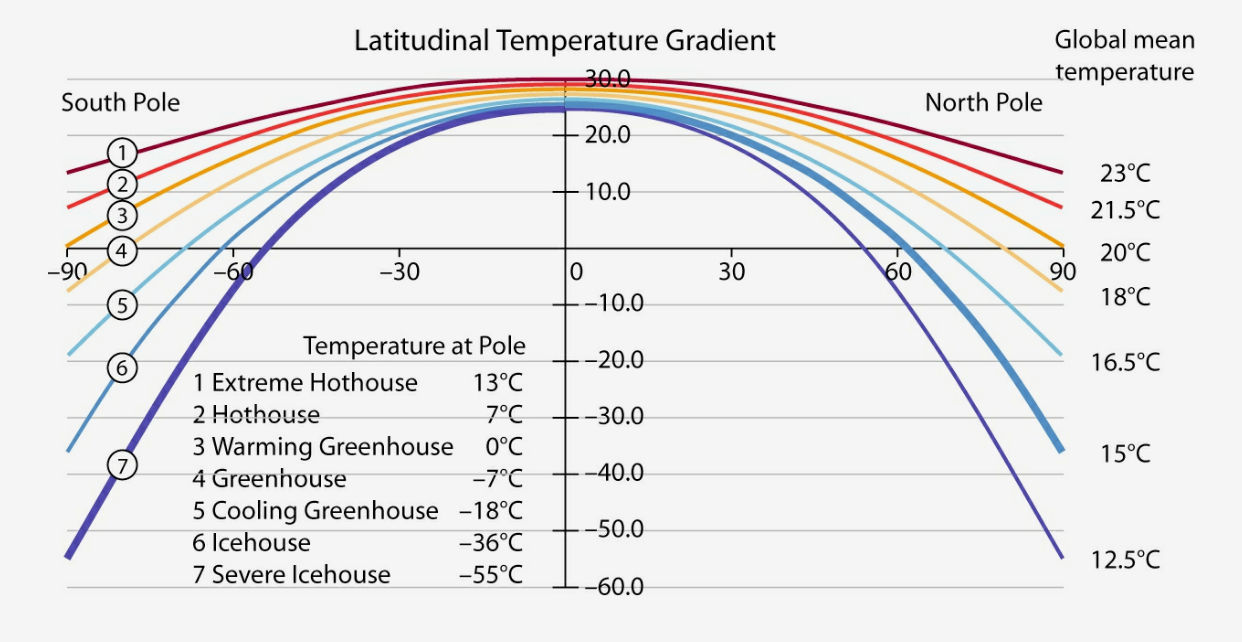
Pole-to-pole curves of latitude versus temperature for climatic conditions ranging from extreme hothouse to severe icehouse, together with the average global temperature. The current climate is represented by curve 7 for the southern hemisphere and curve 6 for the northern hemisphere (thick curves). (Vinós, 2023, ch. 9)
For most of the past 540 million years, the earth has had a greenhouse climate, with average global temperatures of 17-21°C. In the early Triassic (252-238 million years ago), the late Cretaceous (95-80 million years ago), and the early Eocene (60-50 million years ago) it had a hothouse climate, with average temperatures of 22-26°C and little variation across the globe and seasons. At such times the polar regions were ice-free and enjoyed average temperatures of up to 14°C, while in the tropics the temperature was not much higher than today due to abundant rainfall and high humidity. In the early Eocene the poles were about 50°C warmer than today (the Arctic was +14°C compared with -35°C today), and supported palm trees and crocodiles, while the tropics were about 30-35°C. CO2 levels were 450-600 ppm, far too low to explain the worldwide warmth (Vinós, 2023, ch. 20).

Reconstruction of an Eocene pond in the Nothofagus forest of the Antarctic Peninsula. (zenodo)
Given the disinformation spread by the climate hysteria cult, it is not surprising that surveys reveal stunning levels of public ignorance about CO2 (joannenova). Far from being a pollutant, it is a colourless, odourless, tasteless, benign gas that is a vital ingredient in photosynthesis and plant growth, and essential to life on earth. That is why farmers artificially increase the CO2 concentration in glasshouses to between two and three times the current atmospheric level, often by piping in CO2 from nearby power plants. Atmospheric CO2 needs to be above 150 ppm to avoid harming green plants, and would only become harmful to humans at levels over 5000 ppm (Happer, 2011).
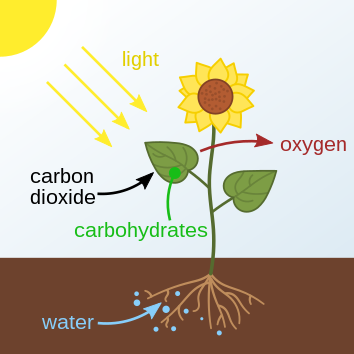
Photosynthesis: Plants absorb carbon dioxide and water and then transform them,
with the
help of sunlight, into carbohydrates (sugar energy), while emitting oxygen.
Rising CO2 levels are supposed to be producing dangerous global warming, catastrophic sea level rise, dangerous ocean acidification, reduced agricultural output, the destruction of many natural ecosystems, and a dramatic increase in extreme weather phenomena, such as droughts, floods and hurricanes. In reality, there is little evidence for any warming-related increases in extreme weather (Extreme weather; Alexander, 2024; wattsupwiththat). For an amusing collection of failed predictions by climate doomsayers, see here.
Rising atmospheric CO2 concentrations have been good for the planet and have significantly enhanced plant productivity, leading to a significant greening of the earth. Doubling the air’s CO2 concentration causes the productivity of herbaceous plants to rise by 30 to 50% and the productivity of woody plants to rise by 50 to 75% (Idso & Idso, 2011). In addition, atmospheric CO2 enrichment typically increases the efficiency of plant nutrient use and water use. AR6 (TS, 80) grudgingly admits that CO2 enrichment has led to a longer growing season in much of the northern hemisphere outside the tropics and to ‘a global-scale increase in vegetation greenness of the terrestrial surface’, i.e. global greening.

Global greening based on leaf area index (LAI). Yellow and blue indicate a positive LAI trend (yellow = negative trend in LAI growth rate; blue = positive). Red and green indicate a negative trend (red = negative trend in LAI growth rate; green = positive). (sciencedirect)
The 1992 United Nations Framework Convention on Climate Change required the signatories to reduce greenhouse gas emissions. It was extended by the Kyoto Protocol, signed in December 1997. Some developed nations did cut their emissions, but by the time the first commitment period ended in 2012 global anthropogenic emissions were 47% higher than in 1997. From 1992 to 2023 emissions rose by 68%.

The earth is now said to be 1.2° warmer than in the late 1800s. According to the climate cult, ‘the science’ shows that further warming must be kept below 1.5°, otherwise the globe will become unlivable – an idiotic claim. Under the 2015 Paris Agreement, greenhouse gas emissions must peak before 2025 (which has not happened), and must be reduced by 43% by 2030 (compared to 2019 levels) and reach net zero (‘carbon neutrality’) by 2050, which means reducing them to a level where the amount emitted equals the amount removed from the atmosphere by carbon sinks or carbon capture. Such goals are utterly delusional (unless global economic collapse occurs). If countries achieve the commitments they have already made, global emissions will fall by just 2.6% by 2030. A survey in early 2025 found that 44% of energy industry executives believed that net zero would not be achieved until 2070 or later.
We are now about halfway between the start of decarbonization in 1997 and the year 2050, when net zero is supposed to be achieved. From 1997 to 2023 the share of fossil fuel in the world's primary energy consumption declined by only 4.2 percentage points, from 85.7% to 81.5%, at a cost of about $5 trillion in green subsidies. But this was accompanied by a massive absolute increase in fossil fuel combustion: in 2023 the world consumed 55.8% more fossil fuel energy than it did in 1997. The absolute cuts in CO2 emissions in Europe (-20.4%) and North America (-8.5%) were far surpassed by massive increases in emissions from the two largest industrializing nations, China (whose emissions rose 3.4 times), and India (whose emissions rose 3.6 times) (ourworldindata).
Even if there was no further increase in CO2 emissions, they would have to be cut by 82% by 2050 to achieve net zero. This would cost wealthy countries at least 20% of their annual GDP (Smil, 2024). It would also require around 700 quintillion (i.e. billion billion) joules of new noncarbon energies by 2050, along with about 5 billion tons of steel, a billion tons of aluminium, over 40 times as much lithium as is currently mined, and up to 25 times the amount of graphite, cobalt and nickel, precipitating steep price rises.
Converting energy-intensive processes such as iron smelting, cement production and plastics production to nonhydrocarbon alternatives would require new technological breakthroughs. By 2050, the making of steel (without coke) and ammonia (without natural gas) would require the production of 135 million tons of ‘green’ hydrogen every year; one kilogram of hydrogen is equivalent to about 33 kilowatt-hours (kWh) of electricity, but its production by electrolysis of water (using green electricity) requires about 50 kWh/kg! Moreover, global energy demand is set to grow by at least 10-15% during this period. No amount of political posturing can alter these harsh realities.
If all nations were to achieve net zero by 2050, this would cost around 2 quadrillion dollars ($2 x 10¹⁵), equivalent to 20 years’ global annual GDP. The result would be to reduce the global temperature in 2050 by no more than 0.1°C (scienceofclimatechange, 6-7; Abbot & Marohasy, 2024, 89). Adaptation to the ever-changing climate is the most rational choice. At present, the world is in the grip of a green mass psychosis, though many participants are only playing along to avoid being ostracized. According to climateactiontracker (run by climate fanatics), no country in the world is taking sufficient action to comply with the Paris Agreement. That is certainly good news.
John Abbot & Jennifer Marohasy (eds.), Climate Change: The facts 2025, Melbourne: Institute of Public Affairs, 2024
Ralph Alexander, Weather Extremes in Historical Context, Global Warming Policy Foundation, report 60, 2024
Ed Berry, Climate Miracle: There is no climate crisis; Nature controls climate, 2020
Ed Berry, ‘The impact of human CO2 on atmospheric CO2’, Science of Climate Change, v. 1.2, 2021, pp. 214-50
Marcel Crok & Andy May (eds.),The Frozen Climate Views of the IPCC: An analysis of AR6, Clintel Foundation, 2023
Jeffrey A. Glassman, Internal modeling mistakes by IPCC are sufficient to reject its anthropogenic global warming conjecture, 2009
William Happer, The truth about greenhouse gases: the dubious science of the climate crusaders, 2011
Hermann Harde, ‘What causes increasing greenhouse gases?’, in: Abbot & Marohasy, 2024, pp. 122-34
Ole Humlum, The State of the Climate 2023, Global Warming Policy Foundation, report 61, 2024
O. Humlum, K. Stordahl & J.-E. Solheim, ‘The phase relation between atmospheric carbon dioxide and global temperatures’, Global and Planetary Change, v. 100, 2013, pp. 51-69
Craig D. Idso & Sherwood B. Idso, Carbon Dioxide and Earth’s Future: Pursuing the prudent path, 2011
Zbigniew Jaworowski, ‘The sun, not man, still rules our climate’, 21st Century Science & Technology, 2009, pp. 10-28
Pavel Kalenda, ‘What was the first? Temperature or CO2?’, Science of Climate Change, v. 4.3, 2024, pp. 32-8
J. Kirkby, ‘Cosmic rays and climate’, Surveys in Geophysics, v. 28, 2007, pp. 333-75
Demetris Koutsoyiannis, ‘The relationship between atmospheric temperature and carbon dioxide concentration’, Science of Climate Change, v. 4.3, 2024a, pp. 39-49
Demetris Koutsoyiannis, ‘Stochastic assessment of temperature-CO2 causal relationship in climate from the Phanerozoic through modern times’, Mathematical Biosciences and Engineering, v. 21, no. 7, 2024b, pp. 6560-6602
Demetris Koutsoyiannis & Christos Vournas, ‘Revisiting the greenhouse effect – a hydrological perspective’, Hydrological Sciences Journal, v. 69, no. 2, 2024, pp. 151-64
Richard Lindzen, An Assessment of the Conventional Global Warming Narrative, Global Warming Policy Foundation, technical paper 5, 2022
R. Lindzen & Y.-S. Choi, ‘On the observational determination of climate sensitivity and implications’, Asia-Pacific Journal of Atmospheric Sciences, v. 47, 2011, pp. 377-90
R. McKitrick & J. Christy, ‘Pervasive warming bias in CMIP6 tropospheric layers’, Earth and Space Science, v. 7, no. 9, 2020, e2020EA001281
David Middleton, CO2: ice cores vs. plant stomata, 2010
N. Nikolov & K.F. Zeller, ‘Roles of earth’s albedo variations and top-of-the-atmosphere energy imbalance in recent warming: new insights from satellite and surface observations’, Geomatics, v. 4, 2024, pp. 311-41
Harrison H. Schmitt, ‘The role of Greenland and Antarctic cores in climate science’, Science and Environmental Policy Project, 2010, pp. 4-7
C.R. Scotese, H. Song, B.J.W. Mills & D.G. van der Meer, ‘Phanerozoic paleotemperatures: the earth’s changing climate during the last 540 million years’, Earth-Science Reviews, v. 215, 2021, 103503
Vaclav Smil, Halfway between Kyoto and 2050: zero carbon is a highly unlikely outcome, Fraser Institute, 2024
Willie Soon, Ronan Connolly & Michael Connolly, The Unreliability of Current Global Temperature and Solar Activity Estimates and Its Implications for the Attribution of Global Warming, Heritage Foundation, December 2024
Roy W. Spencer, Satellite and climate model evidence against substantial manmade climate change, 2008
Henrik Svensmark & Nir Shaviv, Finally! The missing link between exploding stars, clouds and climate on earth, 2017
Javier Vinós, Climate of the Past, Present and Future: A scientific debate, Madrid: Critical Science Press, 2nd ed., 2022
Javier Vinós, Solving the Climate Puzzle: The sun’s surprising role, Madrid: Critical Science Press, 2023 (Kindle ed.)
Climate models and climate catastrophe
Poleshifts: theosophy and science contrasted